
Home services marketing continues to evolve as homeowners rely on online search, customer reviews, and digital communication to find contractors. At the same time, advertising costs, changing consumer expectations, and competition for qualified leads influence how businesses attract new customers.
Our QuoteFlow Marketing team gathered the following home services marketing statistics to examine industry demand, customer acquisition channels, online reputation, advertising costs, AI-assisted discovery, and lead conversion. The figures come from multiple research sources, and their findings vary by survey population, measurement method, and reporting period.
Key Home Services Marketing Statistics
- The U.S. home services market was estimated at $842 billion in 2026.
- Annual homeowner improvement and repair spending was estimated at $517 billion through the second quarter of 2026.
- The reported average cost per lead for home services search advertising was $90.92 across 3,211 U.S. campaigns.
- Roofing leads had a reported cost per lead of $228.15, compared with $46.99 for cleaning and maid services.
- 97% of consumers reported reading reviews for local businesses.
- 45% of consumers reported using ChatGPT and other generative AI tools for local business recommendations.
- 59% of home service professionals said referrals and repeat customers were ways homeowners found them.
- 75% of service businesses expected revenue to rise in 2026.
- More than 40% of high-intent web inquiries reportedly arrived during evenings and weekends.
- 74% of service businesses did not respond to new leads within five minutes in Blazeo’s 2026 benchmark. (Blazeo)
These statistics cover different parts of the customer journey, from market demand and initial discovery to advertising costs and lead response. They provide useful benchmarks, but they do not represent a single standardized measure of home services marketing performance.
Home Services Industry and Consumer Demand Statistics
The size of the home services market provides context for the opportunities available to contractors. However, market estimates and homeowner spending forecasts measure different aspects of the industry and should not be treated as interchangeable.
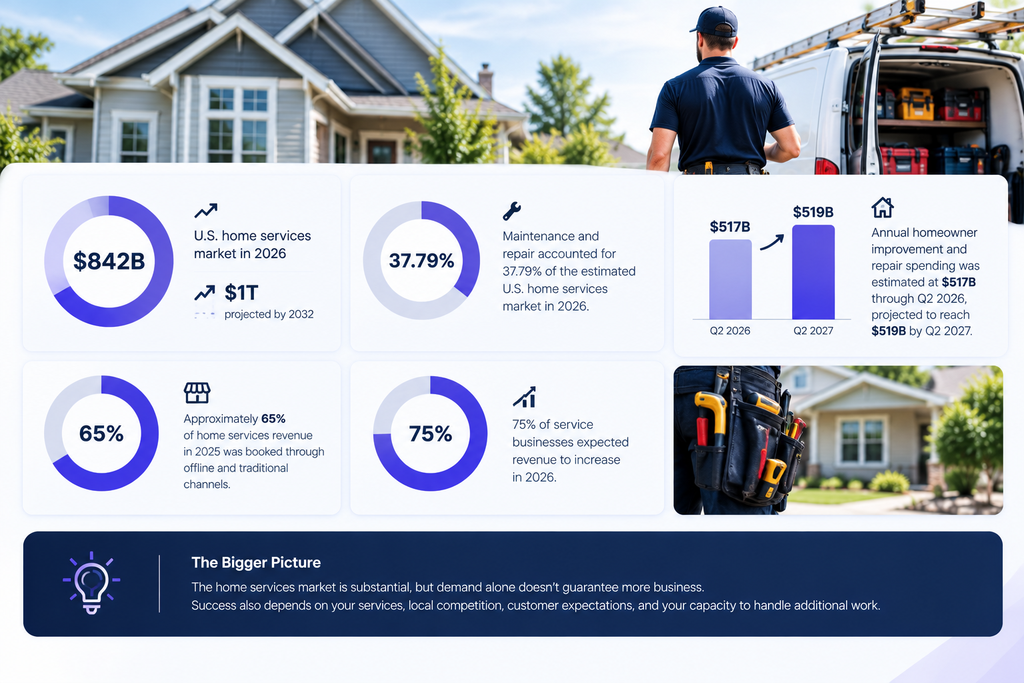
- The U.S. home services market was estimated at $842 billion in 2026, with Mordor Intelligence projecting it to reach approximately $1 trillion by 2032. (Mordor Intelligence)
- Maintenance and repair accounted for 37.79% of the estimated U.S. home services market in 2026. (Mordor Intelligence)
- Annual homeowner improvement and repair spending was estimated at $517 billion through Q2 2026, with spending projected to reach $519 billion over the four quarters ending Q2 2027. (Thomas Town Digital)
- Approximately 65% of home services revenue in 2025 was booked through offline and traditional channels. (Mordor Intelligence)
- 75% of service businesses expected revenue to increase in 2026, according to Jobber’s research. (Jobber)
These figures suggest that home services represent a substantial market, but demand alone does not guarantee that an individual contractor will generate more business. Marketing strategies still need to account for the services offered, local competition, customer expectations, and the company’s capacity to handle additional work.
Home Services Customer Acquisition and Marketing Channel Statistics
Homeowners can discover contractors through personal recommendations, search engines, social platforms, and online directories. Understanding where customers find businesses helps contractors evaluate which channels deserve attention.
- 59% of home service professionals said referrals and repeat customers were ways homeowners found them. (Jobber)
- Facebook was cited by 32% of home service professionals, while Google Search was cited by 20% and Google Local Services Ads by 19%. (Jobber)
- 83% of homeowners reportedly started their search online, while 22% used AI tools such as ChatGPT. (Scorpion)
- 98% of consumers reportedly used the internet to find information about local businesses. (CallRail)
- More than 55% of consumers reportedly searched before scheduling an appointment with a home services business. (CallRail)
These statistics reflect different survey questions and populations, so they should not be interpreted as a direct comparison of channel market share. Referrals may remain an important source of customers while online search and business websites help homeowners evaluate contractors before making contact.
Online Reviews and Reputation Home Services Marketing Statistics
Customer reviews can influence which contractors make a homeowner’s shortlist. Ratings, review recency, review volume, and business responses all contribute to how consumers assess local businesses.
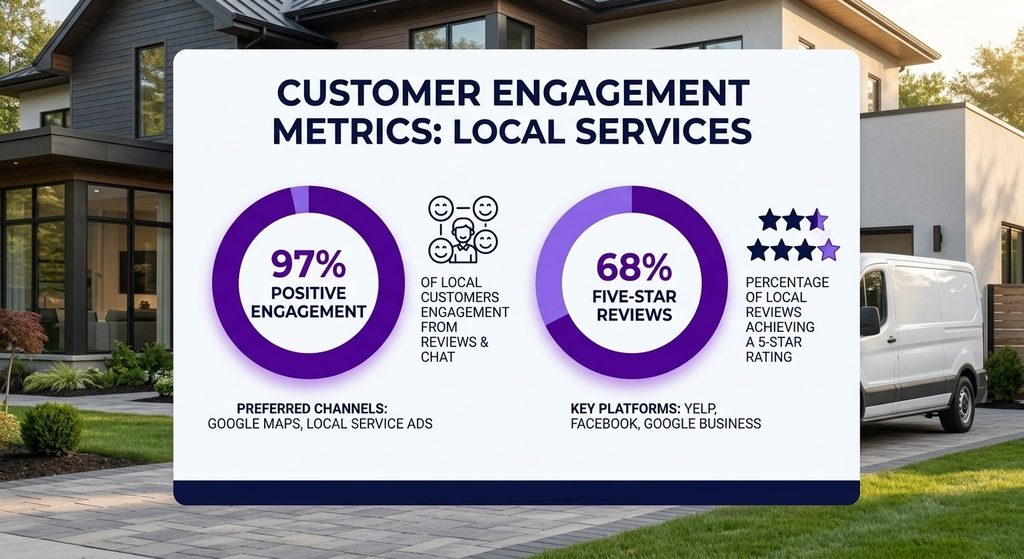
- 97% of consumers reported reading reviews for local businesses, and 41% said they always read them when browsing for businesses.
- 68% of consumers said they would only use a business rated at least four stars.
- 47% said they would not use a business with fewer than 20 reviews.
- 74% looked for reviews written within the previous three months.
- 85% said positive reviews made them more likely to use a business.
- 80% were likely to use a business that responded to all its reviews, while 42% were unlikely to use a business that never replied.
- 54% of consumers said they would visit a business’s website after reading positive reviews.
These findings come from surveys of consumers choosing local businesses across multiple categories, rather than contractors alone. They nevertheless highlight why review management matters to home services marketing. A strong reputation can help prospective customers evaluate a business, while a clear website gives them an opportunity to confirm its services and service area.
Source: (BrightLocal)
Home Services Advertising Costs and Lead Generation Statistics
Paid-search advertising can help contractors reach people actively searching for services, but the cost of generating inquiries varies considerably by trade. LocaliQ’s 2025 Home Services Search Advertising Benchmarks analyzed 3,211 U.S. campaigns running between April 2024 and March 2025.
- The reported average cost per click across home services search campaigns was $7.85.
- The reported average cost per lead was $90.92.
- Roofing and gutters recorded a reported cost per lead of $228.15, the highest among the listed categories.
- Doors and windows recorded a cost per lead of $200.34, while general contractors recorded $165.67.
- Plumbing and heating and furnaces each recorded a cost per lead of $129.02.
- Cleaning and maid services recorded a cost per lead of $46.99, while pools and spas recorded $45.15.
These benchmarks demonstrate why contractors should compare advertising performance with the appropriate trade category rather than relying on a single industry-wide figure. They also describe advertising leads, not necessarily qualified inquiries, booked appointments, or completed jobs.
A separate analysis of 33 home-service Google Local Services Ads accounts reported a pooled cost of $87 per charged lead and a median account-level cost of $83.67. The dataset covered $776,041 in spending and 8,920 charged leads from 2021 through 2026.
Because this LSA analysis uses a relatively small set of accounts, its results should be understood as findings from that dataset rather than a definitive nationwide benchmark.
Sources: (LocaliQ, Thomas Town Digital)
AI, Online Discovery, and Digital Marketing Trends
Artificial intelligence is influencing how consumers discover local businesses and how service companies handle customer inquiries. However, consumer adoption of AI tools and business adoption of AI are separate measures.
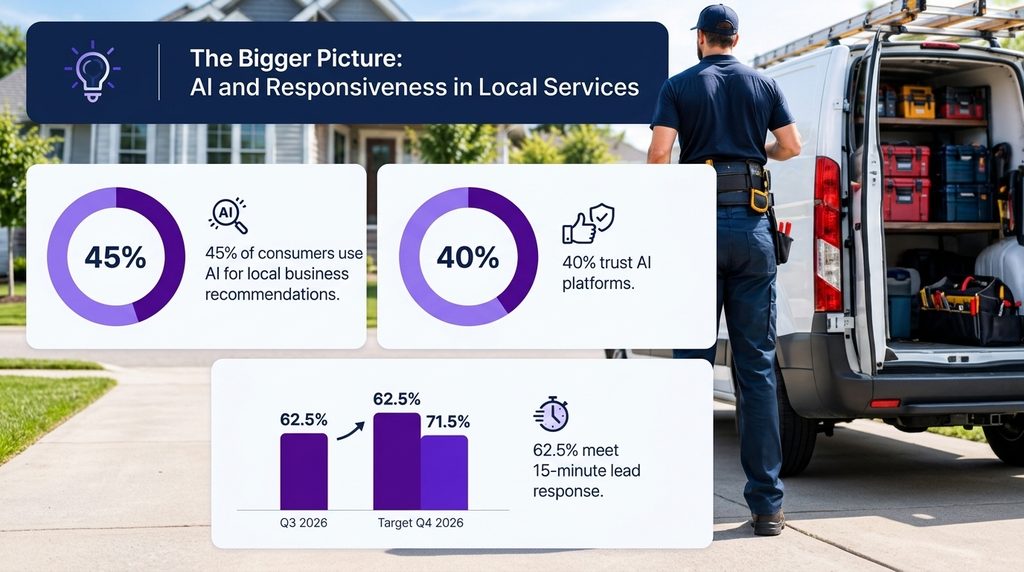
- 45% of consumers reported using ChatGPT and other generative AI tools for local business recommendations. (BrightLocal)
- 40% reported trusting AI platforms for business recommendations. (BrightLocal)
- 49% of U.S. adults reportedly used AI chatbots in June 2026, with approximately four in ten using them to search for information. (Pew Research Center)
- 15.4% of construction businesses reported using AI in a business function during September 2026, compared with 7.4% in November 2025. (Boomcycle Digital Marketing)
- 62.5% of businesses using AI or automation met a 15-minute lead-response standard, compared with 39.1% of businesses using manual operations. (Blazeo)
The findings measure different activities and populations. Consumers using AI to research contractors does not mean that contractors themselves are adopting AI at the same rate. For home services businesses, the figures point to two distinct considerations: how potential customers discover businesses and how quickly businesses respond once an inquiry arrives.
Home Services Lead Response, Missed Calls, and Conversion Statistics
Generating an inquiry is only one stage of customer acquisition. Response times, after-hours coverage, and follow-up practices can influence whether a prospective customer progresses toward an appointment.
- 88% of homeowners expected a response within 24 hours, while 56% wanted 24/7 scheduling or a way to contact a business after hours. (Scorpion)
- More than 40% of high-intent web inquiries reportedly arrived during evenings and weekends. (Blazeo)
- 74% of service businesses did not respond to new leads within five minutes in Blazeo’s 2026 benchmark. (Blazeo)
- 27% of calls to home services businesses went unanswered in Invoca’s platform analysis. (Invoca)
- Fewer than 3% of callers sent to voicemail reportedly left a message. (Invoca)
- 81.2% of companies responding to leads after more than an hour reported losing leads, compared with 46.6% of companies responding within 15 minutes. (Blazeo)
- 57% of home service call centers reported making more than four attempts before marking a lead lost. (Hatch)
These figures come from different studies and should not be combined into one universal response-time benchmark. In particular, the relationship between response speed and reported lead losses does not establish that response time alone determines whether a sale is completed.
Individual company case studies also illustrate possible outcomes. For example, G.L. Hunt Foundation Repair reported recovering $1.8 million in revenue associated with missed calls over 90 days after implementing a call-handling solution. (Hatch case study)
This is a company-reported result, not a typical outcome that every contractor should expect.
Conclusion
Home services marketing statistics highlight the importance of online reviews, customer acquisition costs, and fast lead response. While homeowners continue to rely on referrals, online search and AI-powered tools are creating additional ways for contractors to connect with potential customers. Understanding these trends can help home service businesses make more informed marketing decisions and identify opportunities to generate qualified home service leads.