Auto insurance statistics in 2026 show a market that is expanding, becoming more data-driven, and increasingly influenced by economic pressure, technology, and driver behavior. Premiums are rising, claims are becoming more expensive, and insurers are adjusting pricing models to reflect real-world risk more accurately. At the same time, insurers are adapting through advanced analytics, telematics, and new pricing models.
At QuoteFlow Marketing we’ve gathered the latest auto insurance statistics to help you understand how costs are changing, what is driving those changes, and where the industry is heading next.
Key Auto Insurance Statistics Market Trends
Auto insurance statistics clearly show that the industry is entering a new phase of complexity and growth.
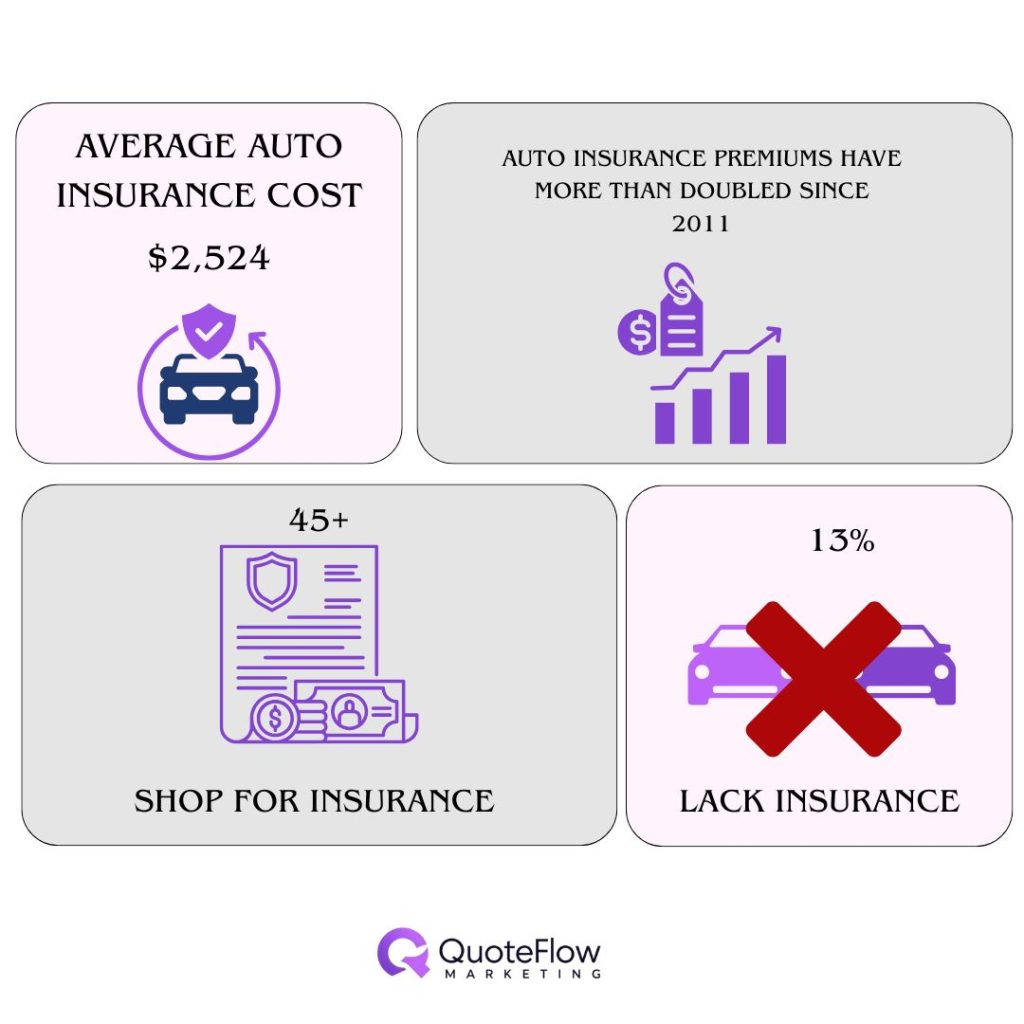
- Average annual auto insurance –the average cost of car insurance in the United States is $2,524, but costs differ significantly based on individual factors such as age, driving history, location, vehicle type, and gender, as well as rising costs driven by inflation, higher repair expenses, and increasing medical costs in 2026.
- Auto insurance premiums have more than doubled since 2011 – auto insurance premiums have more than doubled since 2011, increasing from $1,194 to $2,524, driven by long-term cost pressures such as increased claim severity, excessive litigation, rising vehicle repair costs, and more risky driving, to name a few.
- More than 45% of policyholders shop for insurance at least once per year – consumer behavior is also shifting. More than 45% of policyholders shop for insurance at least once per year, signaling reduced loyalty and increased competition among insurers.
- Approximately 13% of U.S. drivers are uninsured – Roughly 32 million of drivers remain uninsured in 2025. A significant portion of uninsured drivers increases financial risk across the system, often leading to higher premiums for insured drivers.
- Auto insurance costs are rising due to higher claim severity, not more accidents – While accident frequency may not be increasing dramatically, the cost of each claim is significantly higher, which is a key driver of premium increases.
These auto insurance statistics highlight a clear pattern: costs are rising not because accidents are happening more often, but because each claim is becoming significantly more expensive.
Auto Insurance Cost Statistics Reflect Rising Premium Pressure
Auto insurance statistics on pricing show a consistent long-term increase, with a brief decline in 2020 followed by a sharp rebound. The average annual premium was around $1,047 in 2020, increased to over $1,120 by 2022, and has continued climbing through 2025 and 2026 due to inflation, repair costs, and supply chain disruptions.
This upward trend is largely driven by external economic factors. Vehicle repair costs have increased significantly due to advanced technology in modern cars, while labor shortages and higher medical expenses have further pushed claim costs higher. As a result, insurers have adjusted premiums to maintain profitability.
Auto Insurance Cost Statistics by State
Auto insurance costs vary significantly across the United States, with some states paying nearly three times more than others for similar coverage. According to recent data, Louisiana ranks as the most expensive state for auto insurance, while Vermont consistently remains the most affordable.
These differences are largely driven by factors such as population density, weather risks, accident frequency, and state regulations.
Top High Auto Insurance Cost States
| Rank | State | Average Annual Premium (Full Coverage) |
| 1 | Louisiana | $3,718 |
| 2 | Florida | $3,536 |
| 3 | New York | $2,898 |
| 4 | Michigan | $2,859 |
| 5 | California | $2,848 |
Top Low Auto Insurance Cost States
| Rank | State | Average Annual Premium (Full Coverage) |
| 1 | Vermont | $1,237 |
| 2 | Idaho | $1,339 |
| 3 | Maine | $1,408 |
| 4 | North Carolina | $1,412 |
| 5 | Ohio | $1,422 |
Commercial Auto Insurance Statistics Show Rapid Growth
Commercial auto insurance statistics reveal a rapidly expanding segment driven by economic growth, eCommerce, and increased reliance on transportation networks. The global commercial auto insurance market is projected to grow from approximately $199.9 billion in 2025 to $219.2 billion in 2026, with long-term projections reaching over $450 billion by 2035.
This growth is largely fueled by the expansion of logistics and delivery services, as well as the increasing number of vehicles used for business purposes. Liability coverage in the auto insurance market dominates the commercial segment, accounting for more than 60% of the market, due to the high financial risk associated with accidents involving commercial vehicles.
Commercial auto insurance statistics also show rising claim costs, particularly in liability claims, where litigation and settlement amounts continue to increase. Fleet operators face additional challenges related to driver shortages, regulatory compliance, and vehicle maintenance.
Given the growth shown in the latest statistics, agencies that want to stay competitive often rely on commercial auto insurance leads to maintain a steady flow of opportunities.
Auto Insurance Statistics by Age and Gender
Auto Insurance Statistics by Age
Recent data shows that auto insurance costs vary significantly by age, with younger and older drivers typically paying more than middle-aged drivers.
- Teen drivers (under 20) – teenagers pay the highest premiums ($369/month) due to limited driving experience and a higher likelihood of accidents and claims.
- Drivers in their 20s – rates begin to decrease with premiums reaching around $264/month as drivers gain experience, but they still remain relatively high compared to older age groups.
- Drivers in their 30s – insurance costs continue to gradually decline ($203/month) as driving records stabilize and risk decreases.
- Drivers in their 40s – This group typically sees some of the most balanced and affordable rates or to be more precise having an average rate of $184/month.
- Drivers in their 50s – Premiums continue to trend downward ($165/month), reflecting lower risk profiles.
- Drivers in their 60s – This age group benefits from the lowest average premiums or $155/month due to extensive driving experience and lower claim frequency.
- Drivers in their 70s – Rates begin to increase again reaching up to $166/month as insurers factor in age-related risks such as slower reaction times.
Auto Insurance Statistics by Gender
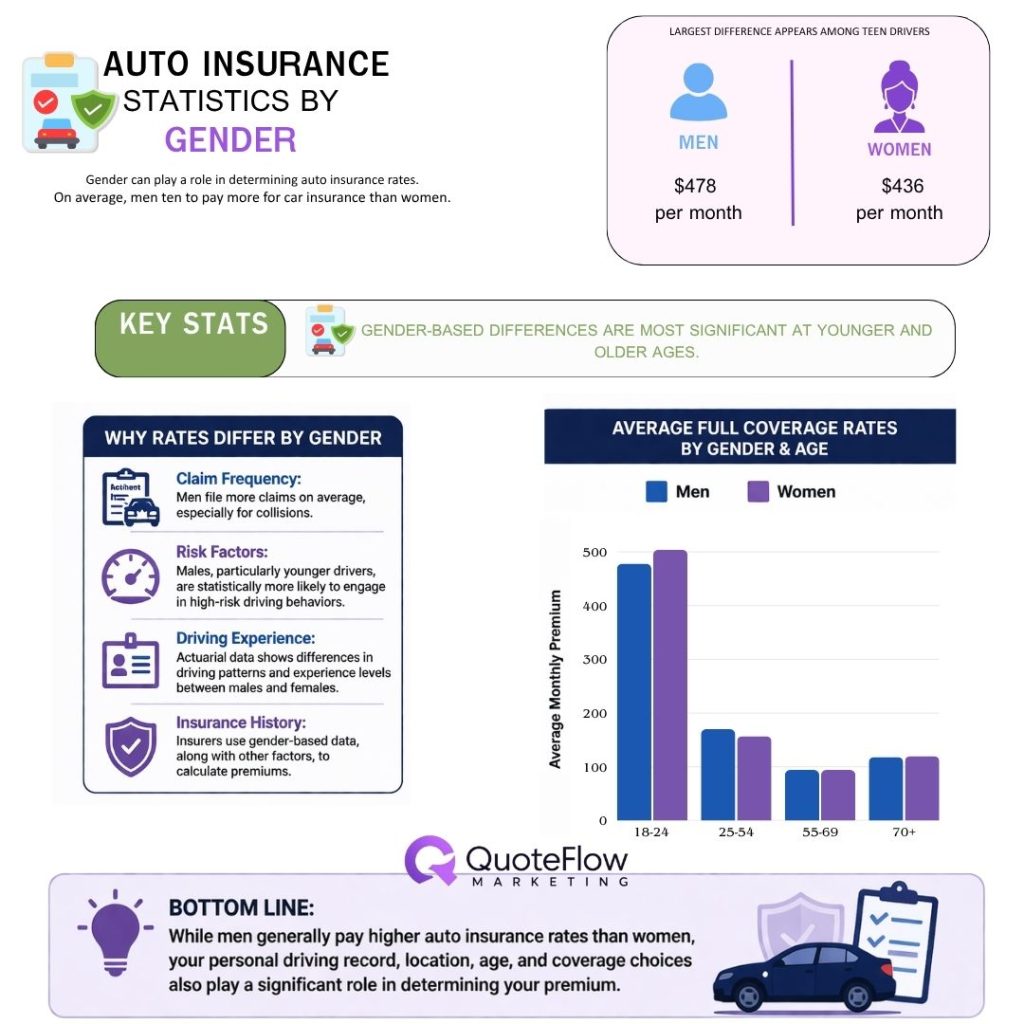
Car insurance premiums differ by gender, but the gap changes significantly with age.
Men generally pay more than women overall, especially at the beginning and end of the age spectrum. The largest difference appears among teen drivers. At age 16, males pay $478/month compared to $436/month for females which is a difference of $42 per month ($504 annually). This gap is largely due to higher accident rates among young male drivers.
As drivers get older, the difference quickly narrows. By age 25, the gap drops to just $2–$3 per month, and by age 30, rates are nearly the same.
During middle age (around 30 to 60), premiums are almost identical for both genders, often differing by only $1–$2 per month or not at all. For example, at ages 55–60, both men and women pay about $94 per month.
In older age, the gap appears again. After age 70, men begin paying slightly more. By age 90, men pay $149/month compared to $137/month for women — a difference of $12 per month.
Overall, the data shows that gender-based differences are most significant at younger and older ages, while middle-aged drivers see nearly identical insurance costs.
Auto Insurance Industry Statistics Show Market Expansion
Auto insurance statistics related to driver behavior provide valuable insight into how risk is evolving. Traffic violations have increased by approximately 17% year over year, surpassing pre-2019 levels. This rise in risky driving behavior directly impacts insurance premiums.
Distracted driving remains one of the most significant factors affecting rates. Data shows there were 315,167 injured drivers due to distracted driving. Drivers who receive citations for texting while driving and can see their premiums increase by around 28% but it ranges from 9% to 51%. Similarly, serious violations such as hit-and-run incidents can lead to even larger premium increases.
Mileage also plays an important role. Drivers who reduce their annual mileage significantly can lower their premiums by around 5% to 6%, reflecting reduced exposure to risk.
These auto insurance statistics show that insurers are increasingly focusing on behavior-based pricing models, where individual driving habits have a direct impact on insurance costs.
Conclusion
Auto insurance statistics in 2026 clearly show an industry shaped by rising costs, evolving risk, and rapid technological advancement. Premiums continue to climb due to higher claim severity, inflation, and more expensive vehicle repairs, while differences in pricing across states, age groups, and driving behavior highlight how personalized the market has become.
Moving forward, understanding these trends will be essential for both consumers looking to control costs and insurers aiming to stay competitive in an increasingly complex market.
Sources:
https://www.usnews.com/insurance/auto/average-cost-of-car-insurance
https://risk.lexisnexis.com/insights-resources/white-paper/auto-insurance-trends-report
https://coheninsuranceservices.com/many-people-drive-without-insurance-matters/
https://www.amaxinsurance.com/blog/car-insurance-rate-increases
https://www.thezebra.com/state-of-insurance/auto/2020/#national-rates
https://www.forbes.com/advisor/car-insurance/rates-by-state
https://insurify.com/car-insurance/driver/age
https://www.moneygeek.com/insurance/auto/average-car-insurance-rates-by-age-and-gender
https://www.nhtsa.gov/risky-driving/distracted-driving
https://www.insurance.com/auto-insurance/auto-insurance-basics/texting-tickets.html
https://finance.yahoo.com/news/commercial-insurance-market-surpass-usd-123300137.html https://www.researchnester.com/reports/commercial-auto-insurance-market/8304