
Healthcare marketing continues to evolve as patients increasingly rely on online search, digital platforms, and provider reviews when choosing where to receive care. At the same time, healthcare organizations are investing in new technologies, content strategies, and digital advertising to attract patients and improve their marketing performance.
We gathered the following healthcare marketing statistics to examine industry spending, patient behavior, SEO, lead generation, social media, AI adoption, and reputation management. The figures come from multiple research sources, and their findings vary by survey population, methodology, and reporting period.
Key Healthcare Marketing Statistics
- 82% of patients research healthcare providers online before booking an appointment.
- 77% of patients search online before booking a healthcare appointment.
- 54% of healthcare website traffic comes from organic search.
- 84% of patients read online reviews before selecting a healthcare provider.
- Digital formats account for 72.2% of healthcare and pharmaceutical media advertising spending.
- 68% of healthcare providers plan to use AI for lead generation and qualification.
- 83% of hospitals use social media.
- 49% of healthcare marketing leaders say they can consistently improve ROI at the appointment level.
- Only 1% of surveyed healthcare organizations can connect more than half of their marketing spending to actual patient outcomes.
- The global healthcare marketing and communications market is projected to reach $43.26 billion by 2032.
These findings highlight how healthcare marketing extends beyond advertising and patient acquisition. Online visibility, provider reputation, appointment convenience, and the ability to measure marketing performance all contribute to how healthcare organizations compete for patients.
Healthcare Marketing Industry Growth, Budgets, and ROI Statistics
Healthcare organizations are allocating substantial resources to marketing as digital channels become an increasingly important part of patient acquisition. Industry growth, advertising expenditure, and changing budget priorities provide insight into how healthcare providers and related businesses approach marketing investment.
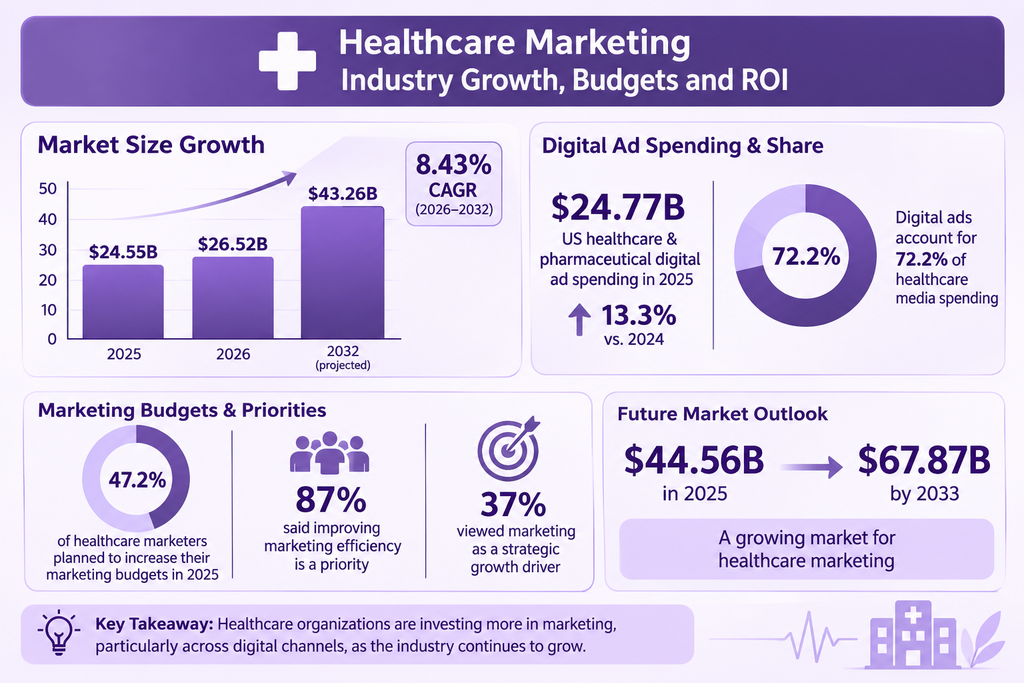
- The global healthcare marketing and communications market was valued at $24.55 billion in 2025 and is projected to reach $26.52 billion in 2026.
- The same market is forecast to reach $43.26 billion by 2032, representing a compound annual growth rate of 8.43%.
- US healthcare and pharmaceutical digital advertising spending reached $24.77 billion in 2025, increasing 13.3% year over year.
- Digital ads accounted for 72.2% of healthcare and pharmaceutical media spending.
- The global healthcare and pharmaceutical advertising market was valued at $44.56 billion in 2025 and is projected to reach $67.87 billion by 2033.
- 47.2% of healthcare marketers planned to increase their marketing budgets entering 2025.
- In a survey of 200 healthcare marketing leaders, 87% said improving marketing efficiency was a priority.
- Only 37% of surveyed executives viewed marketing as a strategic growth driver, while nearly 20% considered it a cost center.
These figures demonstrate the growing investment in healthcare marketing, particularly across digital channels. However, higher spending does not automatically translate into measurable business results. Healthcare organizations still face challenges connecting marketing activities with patient appointments, acquisition costs, and overall revenue.
Sources: (Andava Digital, Freshpaint)
Patient Behavior and Online Healthcare Research Statistics
Patients increasingly use digital channels to discover healthcare providers, compare available options, and evaluate the information they find before making appointments. Search engines, provider websites, online reviews, and digital communication all play a role in the research process.
- 82% of patients use search engines to find or research healthcare providers.
- 77% of patients search online before booking a healthcare appointment.
- 60% of consumers use the internet to find a new healthcare provider.
- 46% of patients turn to Google when looking for a new provider.
- 68% of patients compare healthcare providers before making a decision.
- Patients visit an average of 5.4 websites during healthcare research.
- 78% of patients expect online appointment booking, while only 41% of practices offer full online scheduling.
- 91% of patients expect a response within 24 hours after contacting a healthcare provider.
- 47% of patients reportedly switch providers after a poor online experience.
- 31% of surveyed patients use AI tools to search for and compare healthcare providers.
These statistics show that patient acquisition often begins before someone contacts a healthcare practice. Provider websites, search visibility, accessible information, and convenient appointment options can all influence whether potential patients continue considering a particular practice.
Sources: (Andava Digital, Forge Apollo, Harmony HIT, Searchlab, )
Healthcare SEO and Content Marketing Statistics
Search engine optimization and content marketing help healthcare organizations attract people researching providers, treatments, and health-related services. Organic visibility can also support patient acquisition by connecting healthcare websites with users who are actively looking for relevant information.
Healthcare SEO and Organic Search
- 54% of healthcare website traffic comes from organic search.
- 79% of healthcare providers planned to make website optimization and SEO a primary strategy.
- Healthcare leads from SEO have a reported 14.6% close rate, compared with 1.7% for outbound leads.
- Nearly 70% of healthcare websites invest in SEO.
- 82% of patients use search engines to find or research healthcare providers.
- The first organic search result receives an average click-through rate of 39.8%, compared with 18.7% for the second position and 10.2% for the third.
- 89% of healthcare-related searches triggered an AI Overview in a BrightEdge study.
Healthcare Content Marketing
- Healthcare blogs reportedly generate 4.8 times more inquiries for practices with active blog content.
- Content marketing generates three times more leads at 62% lower cost than outbound marketing.
- Healthcare blogs can increase organic traffic by 55%–200%.
- FAQ content reportedly reduces inbound patient calls by 18%.
- Healthcare websites that load in under two seconds reportedly convert 47% better.
These findings highlight the importance of combining search visibility with useful website content. Educational articles, provider information, and frequently asked questions can help healthcare organizations reach potential patients while addressing the information they need during the research process.
Sources: (Andava Digital, First Page Sage, BrightEdge)
Healthcare PPC, Lead Generation, and Patient Acquisition Statistics
Paid advertising and lead generation campaigns allow healthcare organizations to reach potential patients through search engines and other digital channels. However, acquisition costs and conversion rates can differ considerably depending on the medical specialty, advertising platform, and type of patient inquiry.
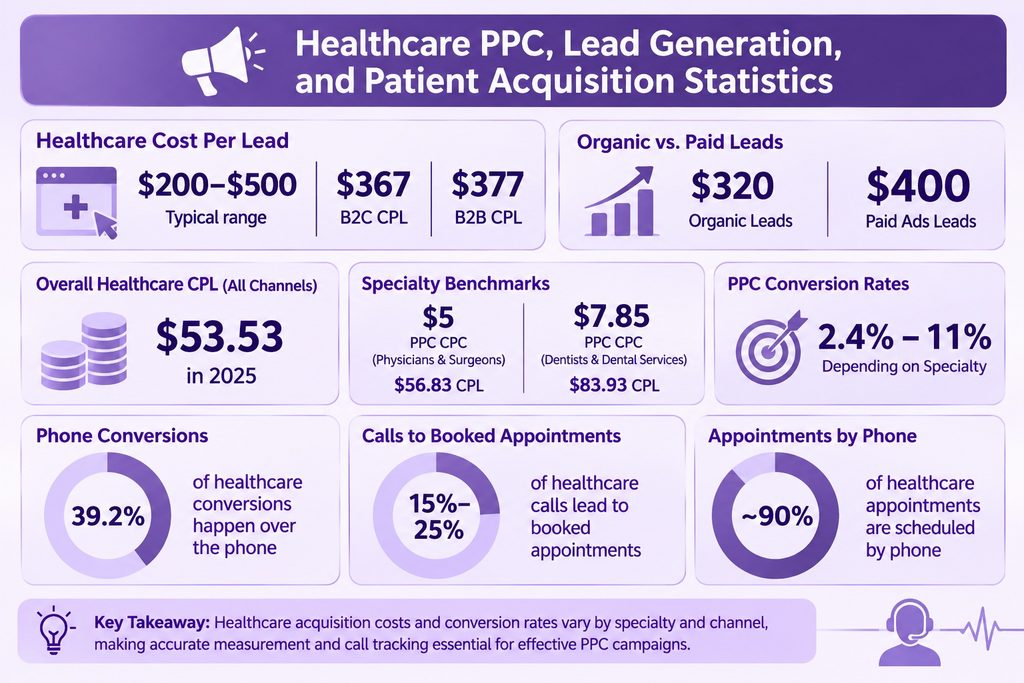
- Healthcare cost per lead typically ranges from $200 to $500, according to one industry benchmark.
- Average healthcare B2C cost per lead is $367, compared with $377 for B2B.
- Organic healthcare leads cost approximately $320, while paid ads leads average $400 in the same benchmark.
- The average healthcare cost per lead across all channels was reported at $53.53 in 2025.
- Physicians and surgeons recorded an average Google Ads cost per click of $5, with an estimated cost per lead of $56.83.
- Dentists and dental services recorded an average cost per click of $7.85, with an estimated cost per dental lead of $83.93.
- Healthcare PPC conversion rates range from 2.4% to 11%, depending on the specialty.
- 39.2% of healthcare conversions reportedly happen over the phone.
- Between 15% and 25% of healthcare calls lead to booked appointments.
- Nearly 90% of healthcare appointments are scheduled by phone.
The differences between reported cost-per-lead figures demonstrate why healthcare acquisition benchmarks should be evaluated carefully. Some sources measure specific advertising channels or specialties, while others report broader averages across multiple marketing channels. Phone inquiries also remain an important part of the conversion process, making call tracking and appointment attribution relevant to campaign measurement.
Sources: (Accretive Edge, Andava Digital, WebFX)
Social Media, Video, and Email Marketing Statistics
Healthcare organizations use social media, video, and email to communicate with patients, distribute educational information, and maintain relationships beyond the initial appointment. Each channel supports different marketing objectives, from audience engagement to appointment requests and patient retention.
Social Media Marketing
- 98% of US healthcare marketers use Facebook as part of their marketing activities.
- 83% of hospitals use social media.
- More than 60% of healthcare marketers increased their social media investment in 2025.
- 41% of patients are influenced by social media when choosing a healthcare provider.
- 55% of adults seek health information through social media.
- Educational healthcare posts generate 2.3 times more engagement than promotional posts.
- Instagram records an average healthcare engagement rate of 5%, compared with 1.9% for Facebook.
Video Marketing
- 85% of healthcare marketers use video as part of their marketing strategy.
- Video on landing pages reportedly increases conversion rates by 34%.
- Patient education videos generate 33% more appointment requests.
- Healthcare-related videos receive approximately 16 billion views per month across platforms.
- 91% of businesses use video marketing, while 90% of marketers report positive ROI from video. These figures cover businesses and marketers more broadly, rather than healthcare organizations alone.
Email Marketing
- Healthcare email open rates range from 22.6% to 41%, depending on the source and measurement.
- The average healthcare email conversion rate is approximately 2.6%.
- Personalized healthcare emails reportedly improve engagement by approximately 140%.
- Referral request emails generate 12%–22% of new patients for practices that use them consistently.
- SMS appointment reminders reportedly reduce patient no-shows by 39%.
These findings illustrate how healthcare marketing channels can support different stages of the patient relationship. Social media and video help distribute information and build engagement, while email and SMS provide direct communication for appointment reminders, follow-ups, and patient retention.
Sources: (Andava Digital, Searchlab, Kaiser Family Foundation, Wyzowl)
AI, Telemedicine, and Emerging Healthcare Marketing Trends
Artificial intelligence and digital healthcare services are creating new opportunities for healthcare organizations to improve communication, automate processes, and reach patients through digital channels. Their adoption is also influencing how providers approach marketing technology and patient acquisition.
Artificial Intelligence in Healthcare
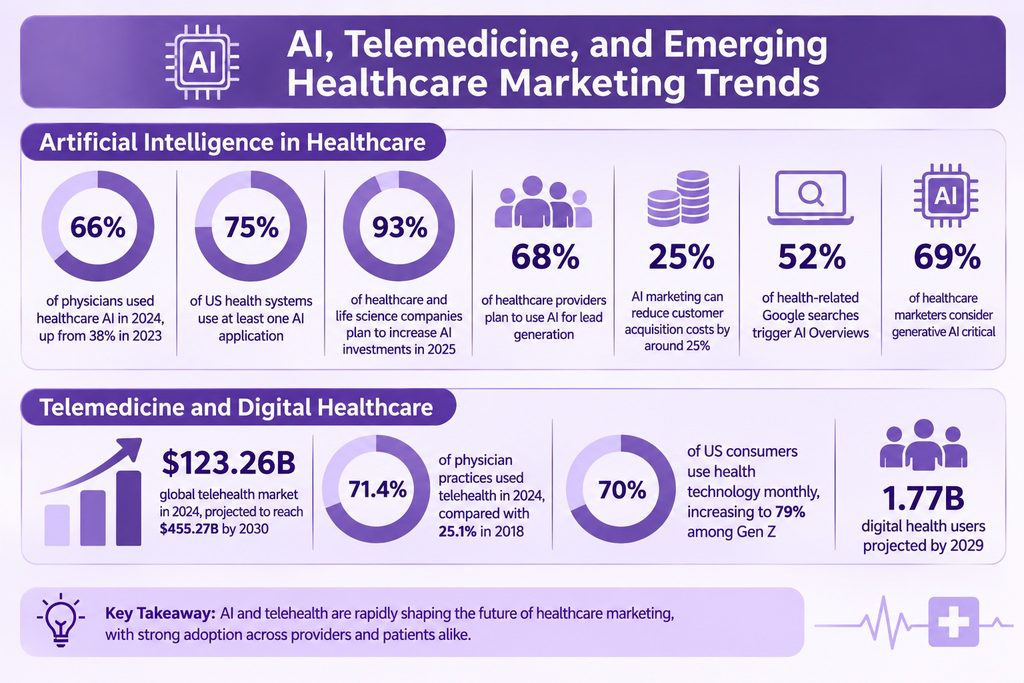
- 66% of physicians used healthcare AI in 2024, up from 38% in 2023.
- 75% of US health systems use at least one AI application, compared with 59% in 2024.
- 93% of healthcare and life science companies planned to increase their AI investments in 2025.
- 68% of healthcare providers plan to use AI for lead generation and qualification.
- AI marketing reportedly reduces customer acquisition costs by approximately 25%.
- 52% of health-related Google searches trigger AI Overviews.
- 69% of healthcare marketers consider generative AI a critical technology.
Telemedicine and Digital Healthcare
- The global telehealth market was valued at $123.26 billion in 2024 and is projected to reach $455.27 billion by 2030.
- 71.4% of physician practices used telehealth in 2024, compared with 25.1% in 2018.
- 70% of US consumers use health technology monthly, increasing to 79% among Gen Z consumers.
- The global digital health market is projected to reach 1.77 billion users by 2029.
These statistics demonstrate the growing role of technology in healthcare delivery and marketing. AI tools, telehealth services, and digital patient communication are becoming increasingly relevant to how organizations attract, engage, and serve patients. However, technology adoption should be distinguished from measurable marketing results, particularly when evaluating acquisition costs and financial returns.
Sources: (Andava Digital)
Online Reviews and Healthcare Reputation Management Statistics
Online reviews are an important part of healthcare provider discovery and evaluation. Patients use ratings and written feedback to compare practices, assess experiences, and decide whether a provider meets their expectations.
- 84% of patients read online reviews before selecting a healthcare provider.
- 94% of patients rely on reviews to evaluate healthcare providers.
- 72% of patients only choose doctors with ratings of four stars or higher.
- 61% of patients prioritize online reviews over personal referrals when evaluating providers.
- 51% of patients read at least six reviews before making a decision.
- 40% of patients have canceled an appointment or care plan because of negative reviews.
- Responding to reviews reportedly increases trust signals by 20%–28%.
- Email review requests generate three to six times more Google reviews than other approaches.
Healthcare Practice Review Benchmarks
A September 2026 study by Ichelon Consulting Group examined public Google Business Profile data from 9,452 US practices across nine specialties and 20 metropolitan areas.
Among the findings:
- Dental practices had an average Google rating of 4.79, with a median of 319.5 reviews.
- Med spas had an average rating of 4.87, with a median of 148 reviews.
- 30.9% of dental practices had at least 500 reviews, compared with only 1.6% of hair restoration clinics.
- Physical therapy practices recorded the highest average rating among the nine specialties at 4.89, while dermatology had the lowest at 4.62.
- Med spas were the most likely specialty to open at least one weekend day, at 74.2%.
These findings show that online reputation involves more than maintaining a high average rating. Review volume, patient feedback, responsiveness, and practice accessibility also contribute to how healthcare businesses appear in local search results and how potential patients evaluate them.
Sources: (Andava Digital, Ichelon Consulting Group)
Healthcare Marketing Measurement Challenges
Measuring marketing performance remains a significant challenge for healthcare organizations. Patient journeys can involve search engines, advertisements, websites, phone calls, reviews, and multiple interactions before an appointment is completed. This makes it difficult to determine which marketing activities directly contribute to patient acquisition.
- Only 1% of surveyed healthcare marketing leaders said their organizations could connect more than half of marketing spending to actual patient outcomes.
- 49% of healthcare marketing leaders said they could consistently improve ROI at the appointment level.
- 91% of surveyed leaders said they use data-driven decisions.
- 82% identified compliance and legal constraints as their biggest marketing obstacle.
- Only 23% of surveyed organizations had fully embedded collaboration between marketing, IT, and compliance teams.
- 57% of healthcare marketing leaders invest in analytics and measurement.
- 64% identified Google Ads as their number-one marketing channel, while Google reportedly closes 58% of conversions initially generated by other channels.
These findings highlight the gap between healthcare marketing investment and the ability to demonstrate its contribution to patient outcomes. Measurement, attribution, and coordination between departments remain important considerations when evaluating marketing performance.
Source: (Freshpaint)
Conclusion
Healthcare marketing statistics show how digital search, online reviews, content, and social media influence patient discovery and provider selection. SEO and digital advertising remain important acquisition channels, while email, video, and online reputation management support engagement and patient communication.
AI and telemedicine are creating additional opportunities, but healthcare organizations still face challenges measuring the financial impact of their marketing activities. Ultimately, successful healthcare marketing requires more than generating traffic or inquiries. It also involves building online visibility, improving patient experiences, and understanding how marketing contributes to appointments and business growth.