Homeowners insurance statistics show a rapidly evolving market, shaped by rising premiums, increasing claims, and growing exposure to weather-related risks. Data from organizations like the Insurance Information Institute and the National Association of Insurance Commissioners highlights a clear trend and that is the costs are rising while demand remains strong. As a result, the homeowners insurance market is becoming more competitive, with insurers adapting quickly to changing conditions.
At QuoteFlow Marketing, we analyzed the market trends and gathered the latest homeowners insurance statistics to keep you informed so you can better understand pricing trends, coverage changes, and what factors are driving the homeowners insurance market this year.
Key Homeowners Insurance Statistics
The latest homeowners insurance statistics provide a clear snapshot of a rapidly evolving market, where costs, risks, and claims continue to rise. Below are the most important figures shaping the industry today:
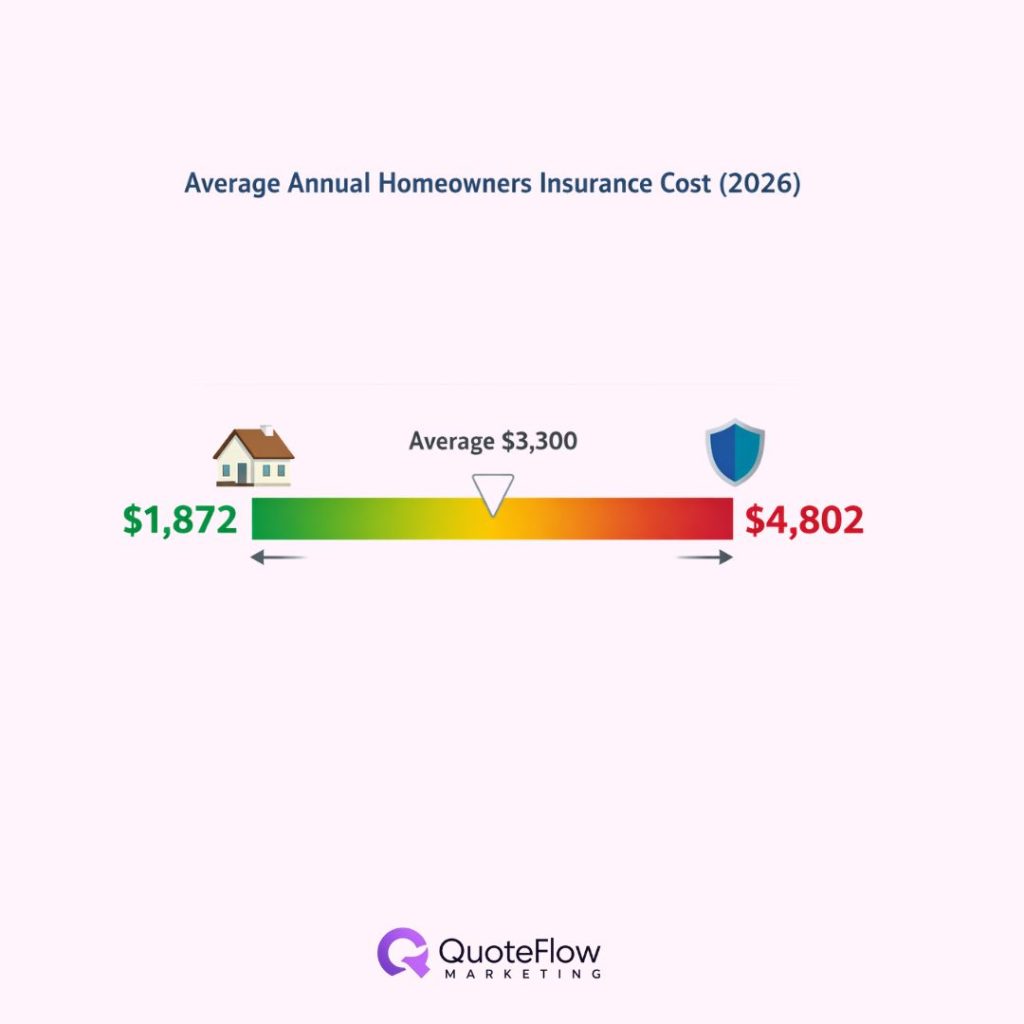
- Average annual cost – homeowners insurance typically ranges between $1,872 and $4,802 per year, reflecting a significant increase compared to previous years.
- Premium growth – insurance premiums have increased by approximately 48% over the past five years, driven by higher rebuilding costs, inflation, and rising claim severity.
- Claim frequency – around 1 in 20 homeowners (about 5%) file a claim each year, showing that while claims aren’t extremely common, they remain a consistent risk factor.
- Most expensive claims – fire and lightning claims are the costliest, averaging close to $83,991 per incident, due to the extensive damage they can cause..
- Insurance coverage rate – About 88% of U.S. homeowners carry insurance, showing strong overall market penetration.
- Weather-related risk exposure – Nearly 32% of homeowners have experienced weather-related damage in the past five years, underscoring the growing impact of climate-related events
These homeowners insurance statistics highlight a market that is under increasing pressure from rising costs and greater risk exposure, while still maintaining strong demand and broad coverage across the United States.
Homeowners Insurance Statistics Cost
Homeowners insurance cost statistics in 2026 reflect a steady upward trend driven by both economic and environmental factors. The national average premium now sits well above historical benchmarks, with most homeowners paying between $175 and $250 per month depending on location, coverage levels, and property risk. To be more precise, the national average cost of home insurance as of 2026 sits at $2,424 per year for a $300,000 dwelling limit, which is about $202 per month.
Over the past decade, costs have accelerated significantly. Before 2020, average premiums were far lower, but a combination of inflation, rising construction costs, and increased claim severity has pushed prices higher year after year. This shift is not temporary. Instead, it represents a long-term recalibration of how insurers price risk. It is expected for the cost to climb even higher by the end of 2026 due to extreme weather and labor shortages.
Monthly premiums vary widely, but the upward trajectory is consistent across most regions. Higher rebuild costs, labor shortages, and supply chain challenges have all contributed to increased policy pricing, making homeowners insurance more expensive to maintain.
It’s worth noting that in the latest homeowners insurance statistics, homeowners with poor credit histories pay over 130% more than those with excellent credit, explicitly showing the difference in cultural settings.
Homeowners Insurance Cost by State
Homeowners insurance statistics by state reveal significant pricing differences driven by regional risk factors. States with higher exposure to natural disasters consistently report the highest premiums, while lower-risk areas benefit from more affordable coverage.
Florida stands out as the most expensive state, with average premiums exceeding $5,800 per year. This is largely due to hurricane risk, flooding exposure, and ongoing market instability. Other high-cost states include Louisiana, Colorado, and Texas, where severe weather events and catastrophic losses continue to drive pricing upward.
In contrast, lower-risk states such as Alaska and Delaware report premiums closer to $1,000 to $1,600 annually. These regions experience fewer large-scale disasters, which helps stabilize insurance costs.
These homeowners insurance statistics highlight how geography plays a critical role in pricing. Coastal areas, wildfire-prone regions, and storm-heavy states consistently see higher premiums, while inland regions remain more affordable.
| State | Avg Annual Premium (2026) | Monthly Equivalent | Relative Cost Level |
| Florida | $7,136 | ~$595 | Very High |
| Louisiana | $5,986 | ~$499 | Very High |
| Kansas | $5,260 | ~$438 | Very High |
| Nebraska | Top tier expensive (≈ high $5,000s) | ~$400+ | Very High |
| Oklahoma | High $4,000s | ~$380+ | High |
| Texas | High $3,000s | ~$325+ | High |
| Colorado | High $3,000s | ~$285+ | High |
| National Avg | $2,543 | ~$212 | Moderate |
| Ohio | ~$1,400–$1,500 (median-range) | ~$115–$125 | Low–Moderate |
| Pennsylvania | ~$800–$1,500 (affordable range) | ~$65–$125 | Low–Moderate |
| Wisconsin | ~$800–$1,500 (affordable range) | ~$65–$125 | Low–Moderate |
| Vermont | ~$800–$1,500 (among lowest) | ~$65–$125 | Low |
Why Home Insurance Is Getting More Expensive
Homeowners insurance statistics clearly explain why costs are rising. Claims have increased by approximately 18% between 2019 and 2023, putting additional pressure on insurers. At the same time, severe weather events are causing record-breaking losses, with convective storms alone generating more than $60 billion in insured losses annually.
Inflation is another major factor. The cost of building materials, labor, and home repairs has risen sharply, increasing the overall cost of claims. As a result, insurers must charge higher premiums to remain profitable and cover potential losses.
Coverage limits are also increasing. More homeowners are purchasing higher dwelling coverage to keep up with rising home values and rebuild costs. This shift further contributes to higher premiums across the market.
As rising claims costs and weather-related risks continue to pressure insurers, many are shifting their focus toward more efficient growth strategies. This includes investing in insurance SEO to capture high-intent organic traffic, as well as leveraging homeowners insurance leads to scale customer acquisition in increasingly competitive markets.
Homeowners Insurance Statistics Per Claim
Homeowners insurance claims statistics provide insight into how often claims occur and how much they cost. On average, about 5% of insured homes file a claim each year. While this frequency has remained relatively stable, claim severity has increased significantly.
The average claim cost now exceeds $13,600, reflecting higher repair costs and more complex damage scenarios. This increase in severity is one of the main drivers behind rising premiums, as insurers adjust pricing to account for larger payouts.
Over time, the gap between claim frequency and claim severity has widened. While the number of claims has not increased dramatically, the cost per claim has risen substantially. This trend is reshaping the entire homeowners insurance market.
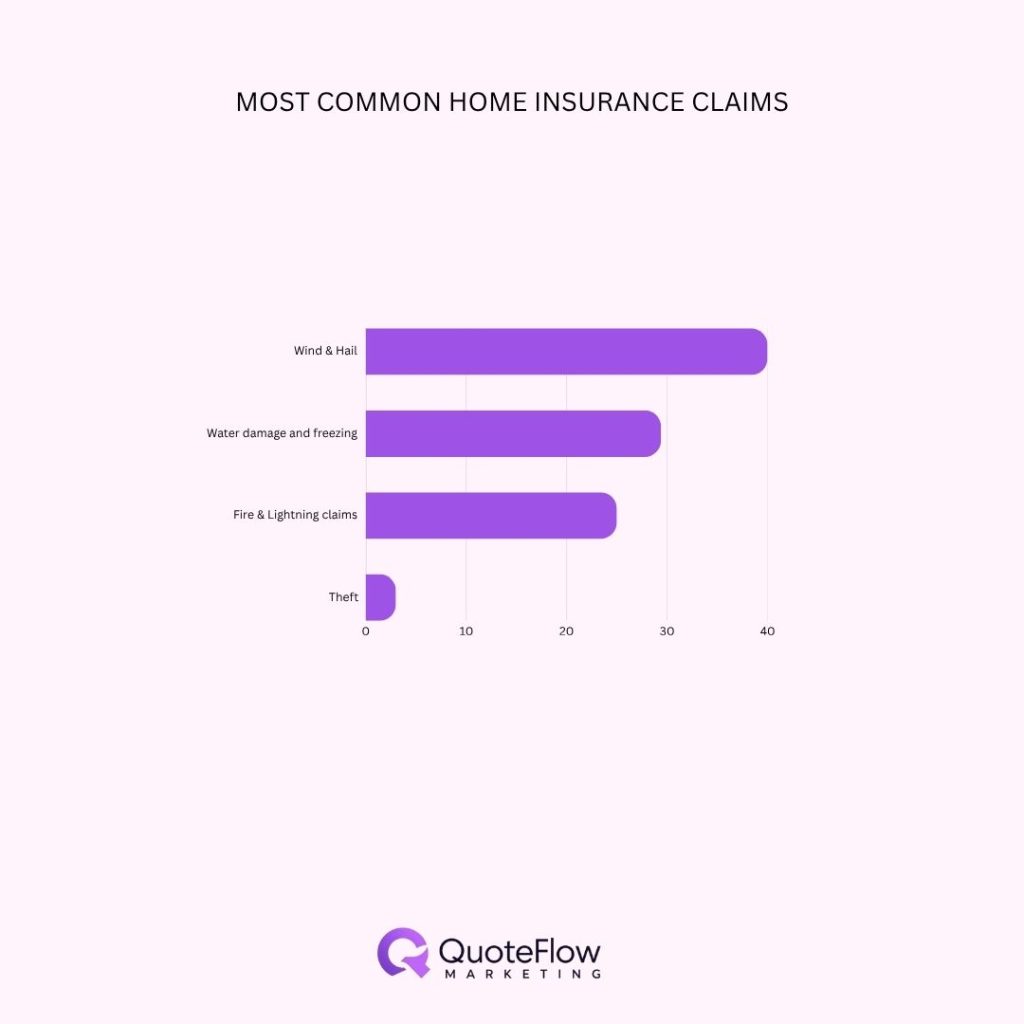
Most Common Home Insurance Claims
Homeowners insurance statistics show that property damage dominates the claims landscape. Wind and hail account for roughly 40% of all claims, making them the most common cause of loss. These events are particularly frequent in storm-prone regions, where severe weather is a regular occurrence.
Water damage and freezing statistics represent another major category, contributing approximately 28-30%. These incidents often result from burst pipes, appliance failures, or weather-related issues.
Fire and lightning claims account for more than 20% of losses, while theft and other claims make up a much smaller percentage, typically around 3% to 4%. Liability claims are relatively rare but can still result in significant costs when they occur.
Home Insurance Market Share Statistics
As per the latest home insurance statics, the homeowners insurance market is dominated by a few large providers. State Farm leads the market with approximately 18% share, followed by Allstate and Liberty Mutual.
In total, the top 20 insurance companies control about 74% of the market. This concentration allows large insurers to leverage scale, technology, and data to manage risk and pricing more effectively.
Conclusion
Homeowners insurance statistics show a market that continues to evolve as premiums rise, claim costs increase, and risk exposure grows across the United States. These changes are largely driven by inflation, higher rebuilding costs, and more frequent severe weather events, all of which place pressure on insurers and policyholders alike. At the same time, demand remains strong, with most homeowners maintaining coverage despite rising costs. Overall, homeowners insurance statistics highlight a more competitive and data-driven market, where understanding pricing trends and risk factors is essential for navigating today’s insurance landscape.
Sources:
https://www.forbes.com/advisor/homeowners-insurance/average-cost-homeowners-insurance
https://www.valuepenguin.com/home-insurance-statistics
https://www.moneygeek.com/insurance/homeowners/homeowners-insurance-statistics
https://www.bankrate.com/insurance/homeowners-insurance/homeowners-insurance-cost/ https://www.kin.com/blog/most-common-home-insurance-claims/
https://www.thezebra.com/resources/home/home-insurance-trends-report
https://www.consumeraffairs.com/homeowners/water-damage-insurance-claims-statistics.html
https://www.aon.com/en/insights/reports/climate-and-catastrophe-report
https://www.iii.org/fact-statistic/facts-statistics-homeowners-and-renters-insurance
https://www.ironpointinsurance.com/home-insurance-claims-costs
https://www.usnews.com/insurance/homeowners-insurance/most-common-claims