
The latest life insurance statistics reveal a fast-evolving market shaped by rising demand, digital transformation, and persistent coverage gaps. While more consumers recognize the importance of financial protection, millions remain uninsured or underinsured, largely due to cost misconceptions and lack of clarity.
At QuoteFlow Marketing, we bring together the most relevant, up-to-date life insurance statistics to give you a complete understanding of the industry today.
Key Life Insurance Statistics
- 52% of U.S. adults have life insurance – this shows ownership is steady, but growth has slowed, signaling a mature and highly saturated market where expansion now depends more on targeting uninsured niches than general awareness.
- 42% of Americans feel underinsured – coverage adequacy remains a major issue, showing that having life insurance does not necessarily mean having enough protection for real financial needs.
- Over 100 million Americans are uninsured or underinsured – highlighting a massive protection gap driven by affordability concerns, lack of guidance, and low perceived urgency among large population segments.
- Global life insurance market reached ~$3.1 trillion in 2024 – and continues expanding toward $4 trillion, and is expected to reach up to $4.8 trillion by 2035, reflecting long-term structural growth supported by rising incomes, aging populations, and financial planning adoption worldwide.
- U.S. life insurance premiumsexceeded $170 billion (individual) and over $800 billion total sector volume – confirming strong market size and stable cash flow, even in periods of economic uncertainty.
- Up to 70%+ of people overestimate life insurance costs – creating a persistent behavioral gap where misinformation and assumptions prevent otherwise willing buyers from taking action.
- 39% of consumers plan to buy life insurance – demand is rising, especially among younger generations who are increasingly motivated by debt, family planning, and financial security concerns.
- One in four consumers purchase life insurance entirely online – reshaping distribution channels as convenience, speed, and online transparency become key decision factors. In a world where most purchase life insurance online, it remains key for agencies to attract life insurance leads online and be visible on search engines.
Life Insurance Ownership & Coverage Statistics
Life insurance statistics around ownership reveal a stable but imperfect market where coverage exists, but often falls short of real financial needs.
Life Insurance Ownership Rates
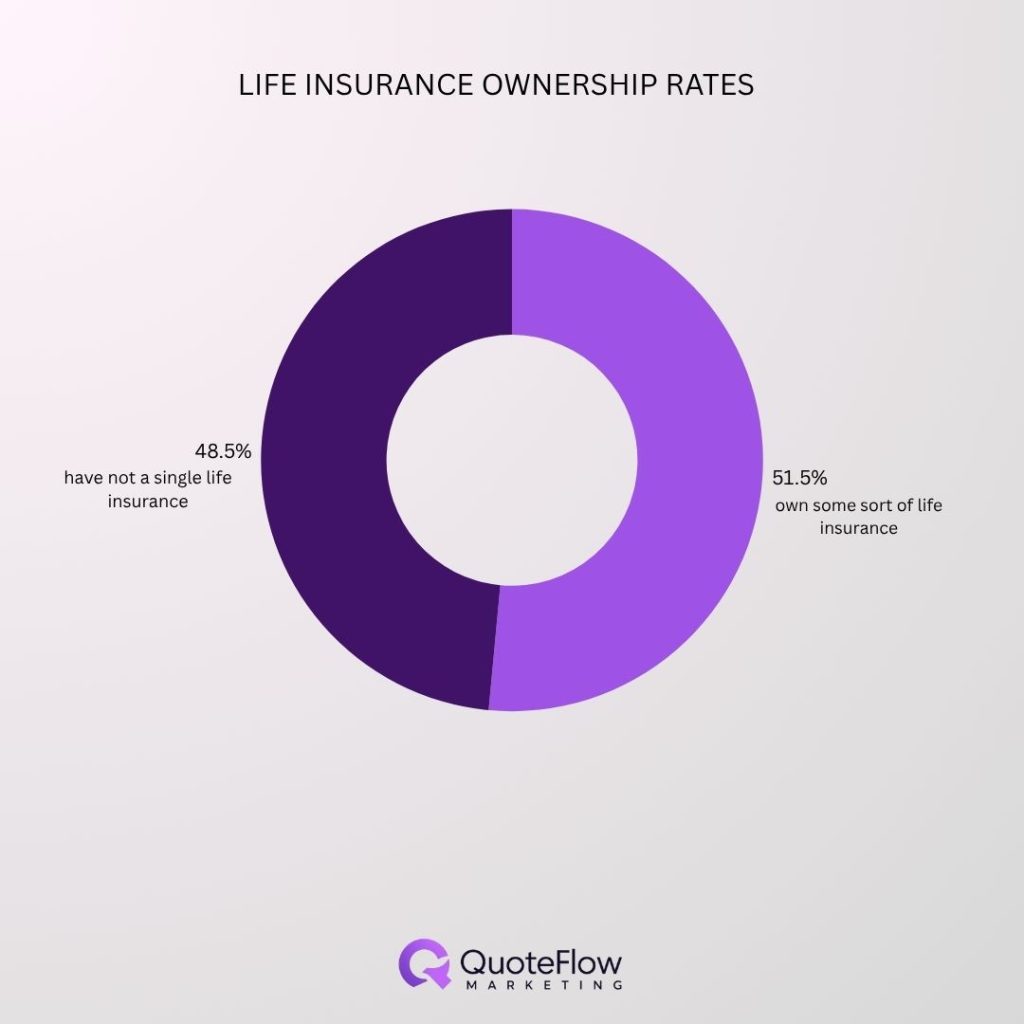
Around 52% of adults own some sort of life insurance, either through individual policies or employer-sponsored group plans, while less than 49% have not a single life insurance. Employer-based coverage plays a significant role, with roughly 1 in 3 policyholders relying on workplace insurance.
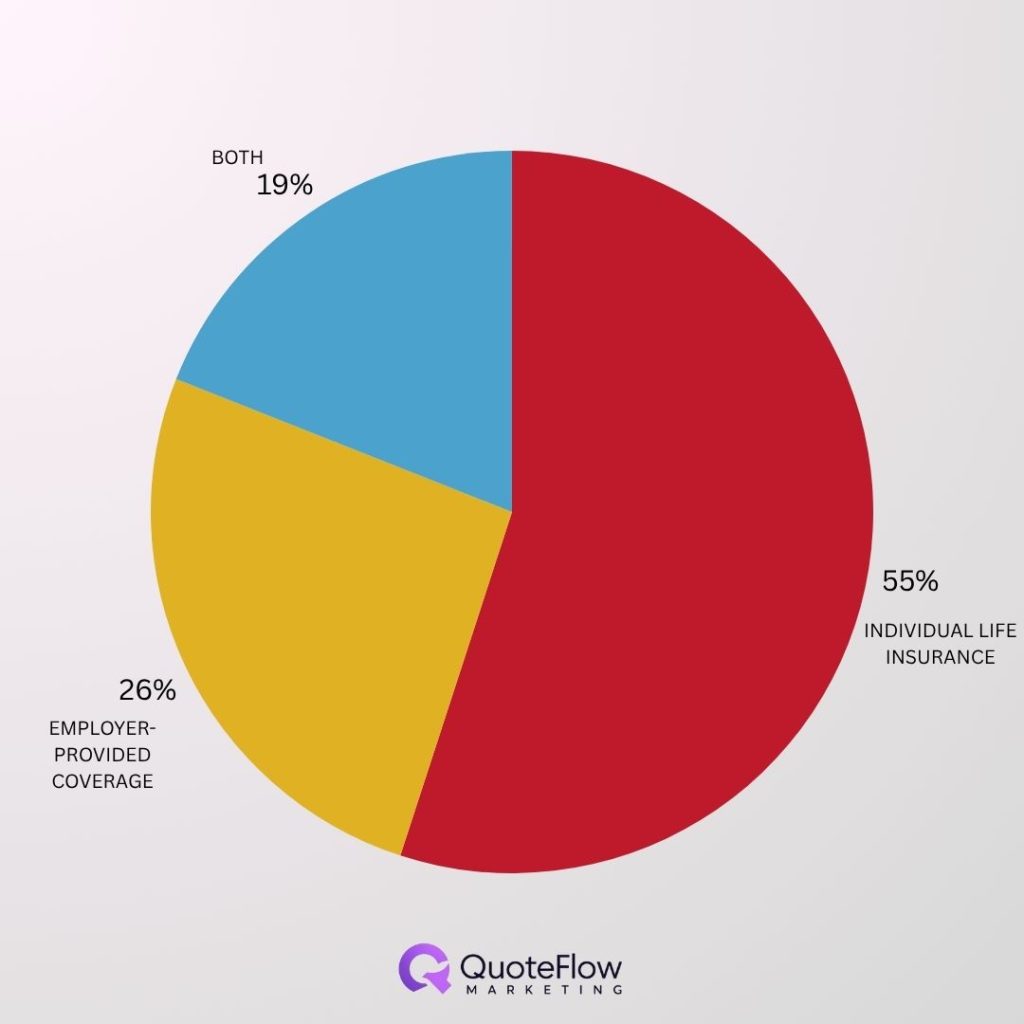
Group life insurance continues to act as an entry point, but it often provides limited coverage. Individual policies, while more comprehensive, require active decision-making, which slows adoption. Because of that, studies show that 55% of policy holders have purchased individual life insurance, while 26% have employer-provided coverage and only 19% have both. This creates a structural imbalance: many people are technically covered, but not adequately protected.
Underinsurance & Coverage Gap
Life insurance statistics consistently highlight a major coverage gap. About 42% of adults say they need more life insurance, while over 100 million Americans remain uninsured or underinsured.
Lower-income households face the greatest risk, with up to 56% reporting insufficient coverage. This exposes families to financial vulnerability, especially in the event of an unexpected loss of income.
The key insight is clear: ownership does not equal financial security. The gap between having a policy and having enough coverage continues to widen.
Consumer Behavior & Buying Trends
Life insurance statistics around consumer behavior reveal a clear gap between intention and action.
Why People Buy Life Insurance
The primary reason people purchase life insurance is to cover final expenses, with around 60% citing this as their main motivation. Income replacement and financial protection for dependents follow closely.
Wealth transfer and inheritance planning are also growing in importance, particularly among higher-income households. As statistics from 2022 show, 43% purchased life insurance so they can leave an inheritance
These motivations are both emotional and financial, combining security with long-term planning.
Why People Don’t Buy Life Insurance
Cost perception remains the biggest barrier. Around 42%–45% of consumers say life insurance to be too expensive, even though most significantly overestimate the actual cost.
Lack of understanding is another key factor, with many consumers unsure about how much coverage they need or what type of policy to choose.
Procrastination also plays a role, as life insurance is often delayed despite its importance.
Purchase Intent Trends
Interest in life insurance is rising, with 39% of consumers planning to purchase a policy. Demand is strongest among Millennials (around 50%) and Gen Z (44%), signaling future market growth.
This trend shows that awareness is increasing, but conversion still depends on education and accessibility.
Life Insurance Industry Statistics
The life insurance industry remains one of the largest financial sectors globally, driven by premiums, investments, and long-term contracts.
Market Size & Growth
Life insurance statistics show that the global market reachedapproximately $3.1 trillion in 2024, with projections pointing toward $4 trillion by 2028 and continued growth beyond 2030.
The United States accounts for roughly 25–27% of global premiums, making it the dominant market worldwide. This scale reflects both high demand and advanced financial infrastructure.
Despite this growth, consumer adoption has not kept pace, creating a paradox between industry expansion and individual coverage gaps.
Premiums & Revenue Trends
Total life and annuity premiums exceeded $800 billion annually in the U.S., with annuities now representing over 55% of direct premiums written.
Traditional life insurance accounts for a smaller share, reflecting a shift toward retirement-focused products. Revenue growth remains strong, supported by investment income and rising interest rates.
This shift signals a broader transformation: life insurers are evolving into full financial service providers.
Life Insurance Cost Statistics
Cost-related life insurance statistics reveal one of the biggest disconnects in the industry.
More than half of consumers believe life insurance is expensive, yet studies show that three-quarters of adults overestimate the true cost of life insurance by 10 to 12 times.
This misconception significantly slows adoption, even among those who recognize the need for coverage.
Term life insurance remains highly affordable, especially for younger individuals. For example, a healthy 30-year-old can often secure substantial coverage for a relatively low annual premium.
Whole life insurance, on the other hand, can cost 5 to 8 times more than term policies, reflecting its cash value and long-term benefits.
The affordability gap between term and permanent policies plays a major role in consumer decision-making.
Demographic Life Insurance Statistics
Demographic life insurance statistics highlight who is covered—and who remains at risk.
Life Insurance by Age
Ownership increases with age. A report from Western & Southern Financial Group found that around 57% of Baby Boomers have coverage, compared to 50% of Millennials, 55% of Gen X and roughly 36% of Gen Z, the lowest of any generation.
Younger generations show growing interest but lower actual ownership, reflecting early-stage financial planning.
What’s interesting to look at the younger generations is how they gather valuable information about making a life insurance purchase. Nearly half of Gen Z and Millennials value advice from educated experts. 45% of them follow financial advisors on social media, while 33% says they follow financial influencers to gather valuable data and make an informed decision.
Gender Differences
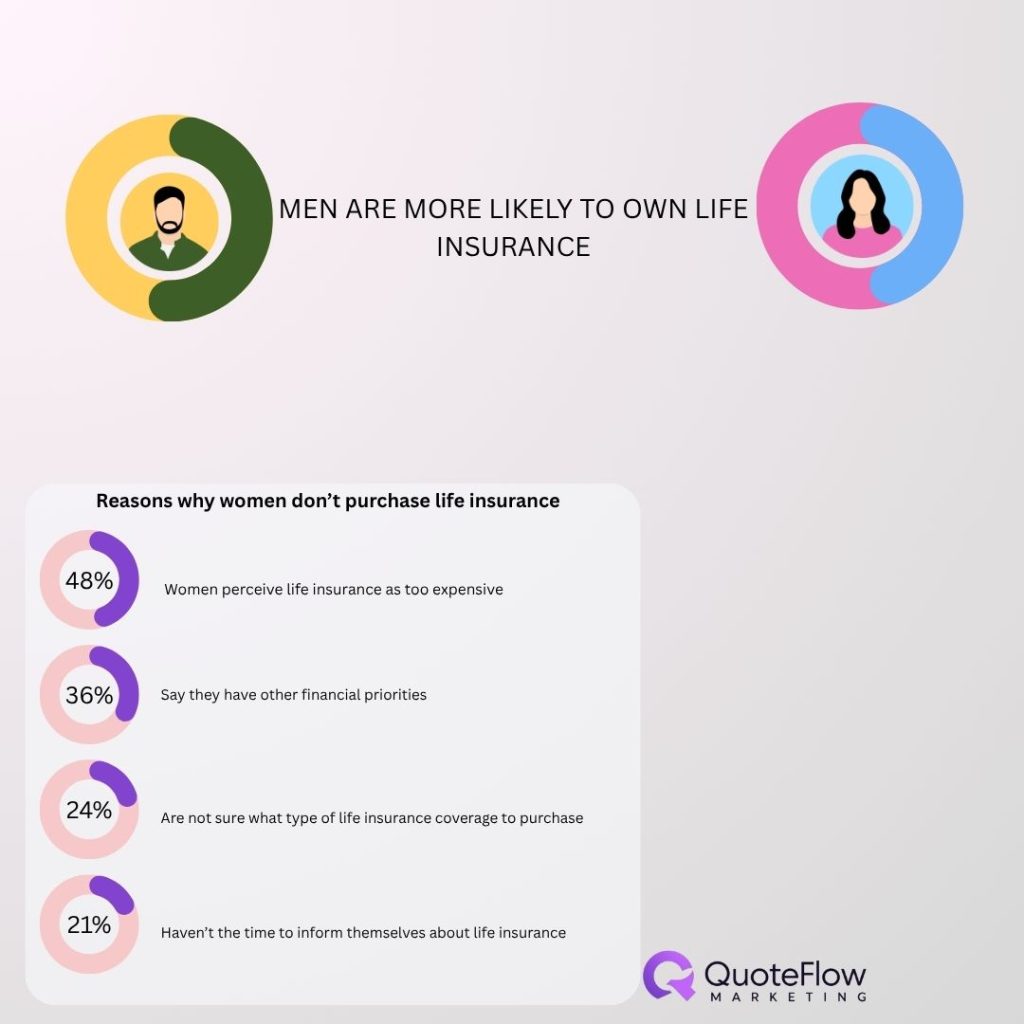
Men are more likely to own life insurance, with ownership rates around 54% compared to 48% for women. As a matter of fact, less than 23% feel extremely knowledgeable about life insurance coverage while 1 in 10 women believe they’re not knowledgeable at all.
There’re a couple of reasons why women don’t own life insurance. These include:
- 48% of women perceive life insurance as too expensive
- 36% say they have other financial priorities
- 24% are not sure what type of life insurance coverage to purchase
- 21% haven’t gotten the time to inform themselves about life insurance
However, women are more likely to report needing additional coverage, indicating a significant gap.
Income & Family Status
As life insurance statistics show, households with children are more likely to have life insurance, with ownership around 59%, compared to lower rates among non-parents.
Single mothers represent one of the most underinsured groups, with only 41% having coverage, despite higher financial responsibilities.
These patterns show that those who need coverage the most are often the least protected.
Digital & Distribution Trends
Modern life insurance statistics highlight a rapid shift toward digital experiences.
The way of purchasing life insurance in today’s world and age only points out to the staggering insurance marketing statistics. With one in four consumers purchasing life insurance online, and nearly three-quarters of consumers exploring options online, the digital world has definitely reshaped the distribution channels.
As a result, visibility in search has become a key factor in how insurers connect with high-intent consumers, particularly for those refining their digital visibility through approaches such as SEO for insurance.
Advancements in AI and automation are transforming underwriting, claims processing, and customer experience.
These innovations reduce friction and improve accessibility, making life insurance easier to understand and purchase.
Conclusion
Life insurance statistics in 2026 point to a clear direction. The market is growing, demand is increasing, and digital transformation is accelerating access. At the same time, a large coverage gap persists, driven mainly by cost misconceptions and lack of education.
Younger generations are showing strong intent to buy, signaling future expansion. However, turning that intent into action depends on simplifying products, improving transparency, and closing knowledge gaps.
The most important takeaway is simple: life insurance is more relevant than ever, but understanding it remains the key to unlocking its full value.
Sources:
https://fredblog.stlouisfed.org/2025/10/how-large-is-the-us-life-insurance-industry/ https://www.policygenius.com/health-insurance/health-insurance-literacy-survey-2021/ https://www.limra.com/en/newsroom/industry-trends/2024/life-insurance-awareness-month-a-time-to-help-more-consumers-get-the-life-insurance-coverage-they-say-they-need https://amalgamatedbenefits.com/amalgamated-life/why-millions-still-lack-life-insurance-in-2025-and-how-to-close-the-gap/ https://www.swissre.com/institute/research/sigma-research/sigma-2024-05-global-economic-insurance-outlook-growth-geopolitics.html https://www.swissre.com/dam/jcr:36ebe594-097d-4d4d-b3a7-2cbb8d856e85/150Y_Markt_Broschuere_USA_EN_Inhalt.pdf
https://www.iii.org/fact-statistic/facts-statistics-life-insurance
https://choicemutual.com/original-research/life-insurance-statistics
https://www.westernsouthern.com/life-insurance-in-america
https://www.limra.com/siteassets/newsroom/liam/2025/Women_Life_Insurance_2025.pdf
https://choicemutual.com/original-research/life-insurance-statistics
https://www.reinsurancene.ws/us-life-insurance-premiums-hit-record-17-5bn-in-2025-limra/