
Dental marketing has become increasingly dependent on digital channels as patients use search engines, online reviews, mobile devices, and websites to find and evaluate dental providers. From attracting new patients to building awareness around specific services and generating opportunities such as new dental insurance leads, practices and dental-related businesses are competing for attention across more digital channels than ever.
The latest dental marketing statistics provide a clearer picture of these trends, covering search visibility, paid advertising, online reputation, website performance, patient acquisition, and retention. The statistics below are compiled exclusively from the four sources provided for this article, with figures presented in their original context when different sources report different benchmarks.
Online Search and Dental Patient Acquisition
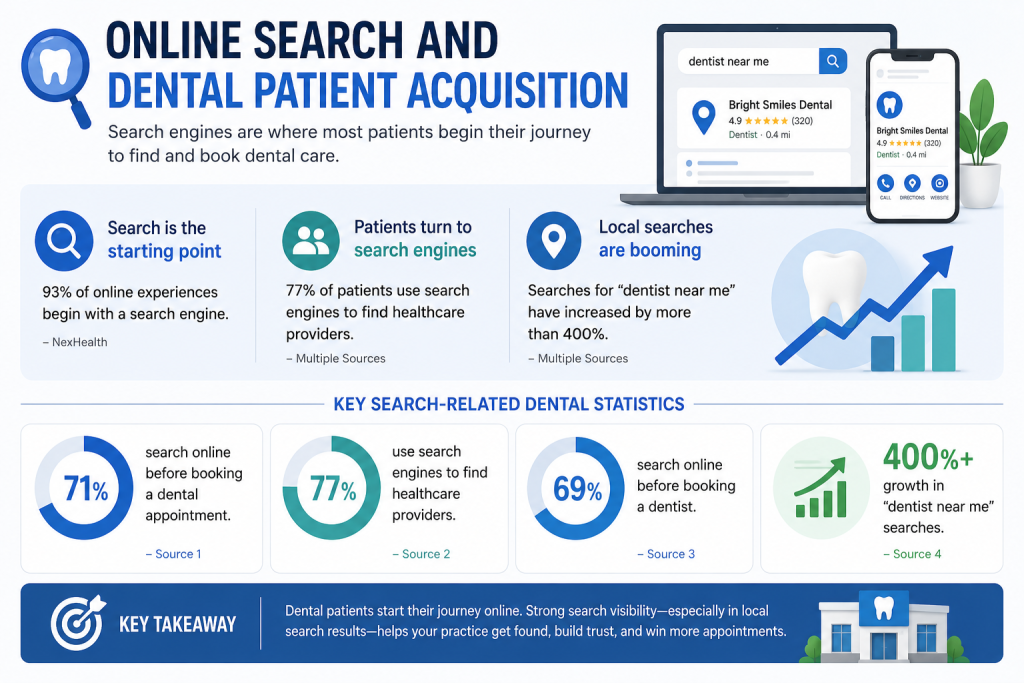
Search engines are one of the most important ways patients discover healthcare providers. One source reports that 71% of individuals search online before booking a dental appointment, while another reports that 69% of people search online before booking a dentist.
A separate source reports that 77% of patients use search engines to find healthcare providers, illustrating the importance of appearing prominently when prospective patients begin researching their options. NexHealth also states that approximately 93% of online experiences begin with a search engine.
Local intent is another important part of dental discovery. According to one of the supplied sources, searches for “dentist near me” have increased by more than 400%, highlighting the importance of local visibility for practices competing for nearby patients.
The sources therefore point to several important search-related trends:
- 71% search online before booking a dental appointment.
- 77% use search engines to find healthcare providers.
- 69% search online before booking a dentist.
- More than 400% growth has been reported for “dentist near me” searches.
The growing use of conversational and location-based search also connects with broader voice search statistics, particularly as consumers increasingly use voice assistants to find nearby businesses and services.
Sources: (Web Tonic, Ortho Marketing, Zevi Digital, NexHealth)
Dental SEO and Organic Search Statistics
Organic search remains an important source of long-term visibility for dental practices. Strong research reports that acquiring a new patient through SEO and organic search costs approximately $50–$150, while SEO is associated with a reported 5:1 to 20:1 return on ad spend (ROAS) after an initial 6–12 month investment period.
NexHealth notes that organic search can contribute to website traffic and conversions as practices optimize their websites for search engines. The source also states that SEO can increase traffic to local listings, websites, and social media.
At the same time, the supplied data shows that paid and organic search can perform differently. NexHealth cites research reporting that paid search had a 35% higher conversion rate for websites than organic search visits.
SEO benchmarks reported in the sources
| SEO Metric | Reported Statistic |
| Organic patient acquisition cost | $50–$150 |
| Reported SEO ROAS | 5:1–20:1 |
| Initial SEO investment period | 6–12 months |
| Online experiences beginning with search | 93% |
These dental marketing statistics demonstrate why SEO can be viewed as a long-term acquisition channel, while paid search can provide a different path to conversions. The emphasis on organic visibility, content, and long-term search performance also reflects broader inbound marketing statistics.
Sources: (Web Tonic, NexHealth)
Google Ads and Paid Dental Marketing
Paid search is another major component of dental marketing. Research cited by Ruler Analytics indicates that 35% of dental website traffic comes from paid search, making it a significant source of online visitors.
Dental advertising benchmarks also show that costs can vary considerably depending on the keyword and treatment being promoted. Google Ads CPC for dental keywords ranges from $2.50 to $6.85, while dental Google Ads CTR is reported at 12.1% in one set of industry benchmarks. Another study reports an average Google Ads CTR of 5.92% for the dental industry. Patient acquisition costs can also vary by service:
- General Google Ads: $250–$500 per new patient
- Google Ads for implants: $800–$2,000 per new patient
- Dental Google Ads CPC: $2.50–$6.85
- Google Ads ROAS: 4:1–8:1
Dental digital marketing research also reports that 75% of dental offices use Google Ads, while 60% of those offices report a positive return on investment.
These figures illustrate the range of paid advertising benchmarks available to dental practices, particularly when campaigns target high-value treatments such as implants.
Sources: (Arch Dental Marketing, Web Tonic, Zevi Digital, ZipDo)
Online Reviews and Dental Reputation
Online reviews have become an important part of how prospective patients evaluate dental providers. Research from Dentaly indicates that 83% of Americans rely on online reviews to evaluate a provider, while 85% use Google when selecting a dentist.
The same research found that 52% of individuals will only consider a provider with at least 10 reviews. Negative feedback can also have a significant effect: 95% of people think twice after reading negative reviews, yet only 35% of dentists respond to unfavorable ratings.
Additional research published by Zevi Digital reports that 94% of patients use online reviews to evaluate healthcare providers.
The figures vary across studies, but they consistently demonstrate the importance of online reputation in the dental patient acquisition process. Reviews can influence whether prospective patients consider a practice, which makes reputation management an important part of dental marketing.
Sources: (Dentaly, Web Tonic, Zevi Digital)
Website, Mobile, and Online Booking Statistics
A dental practice’s website often serves as the destination for patients who discover the practice through search, advertising, social media, or other digital channels. Website performance and convenience can therefore influence how effectively marketing traffic turns into appointments.
According to NexHealth, only 26% of dental practices offer online booking, while 77% of patients choose a provider that offers online scheduling. Zevi Digital reports a similar preference, finding that 68% of patients are more likely to choose providers offering online booking.
Mobile behavior is equally important. Dental marketing research reports that 68.5% of dental website traffic is mobile, while 60% of individuals use a mobile device to find a dentist and 45% of mobile users book directly from the website.
Website and Mobile Benchmarks
| Metric | Reported Statistic |
| Dental website traffic from mobile | 68.5% |
| Individuals using mobile to find a dentist | 60% |
| Mobile users booking directly from a site | 45% |
| Dental practices offering online booking | 26% |
| Average website conversion rate | 4.2% |
| Landing page conversion rate | 12.5% |
| Average dental website conversion rate | 2.3% |
| Mobile users abandoning slow sites | 53% |
Website conversion benchmarks also vary by study. One set of dental marketing benchmarks places the average website conversion rate at 4.2%, with dedicated landing pages reaching 12.5%. Zevi Digital reports an average dental website conversion rate of 2.3%.
The differences reinforce the importance of considering the methodology and benchmark being used when evaluating website performance.
Sources: (Web Tonic, NexHealth, Zevi Digital)
Dental Marketing Budgets, Acquisition Costs, and ROI
The available dental marketing statistics also provide benchmarks for promotional spending, patient acquisition costs, and marketing returns.
Research published by Inside Dental reports that 54% of practices spend between $1,000 and $5,000 per month on online promotion. Its practice-level spending benchmarks include:
- Solo practices: $2,000–$4,000 per month
- Two-doctor practices: $5,000–$7,000 per month
- Startups: $6,000–$14,000 per month
- Multi-location groups: $10,000–$25,000+ per month
The same research reports that practices allocating 4–12% of revenue to promotion see higher year-over-year growth than those spending less. Startups are listed at 15–20% of revenue, while established multi-location groups are listed at 6–12%.
Reported return-on-ad-spend benchmarks also vary significantly by channel:
| Marketing Channel | Reported ROAS |
| SEO / Organic | 5:1–20:1 |
| Google Ads | 4:1–8:1 |
| Meta Ads | 2.8:1–5:1 |
| Email Campaigns | 36:1–44:1 |
| Referral Programs | 10:1+ |
These figures represent reported benchmarks rather than guaranteed returns. Actual performance can vary depending on the channel, service being promoted, practice type, and marketing execution. Similar variations can be seen across other specialized markets, where insurance marketing statistics also show differences in spending, acquisition channels, and digital marketing performance.
Sources: (Web Tonic)
Patient Retention, Referrals, and Marketing Automation
Dental marketing extends beyond acquiring new patients. Retention, follow-up, referrals, and automation can also influence the long-term value generated from a practice’s patient base.
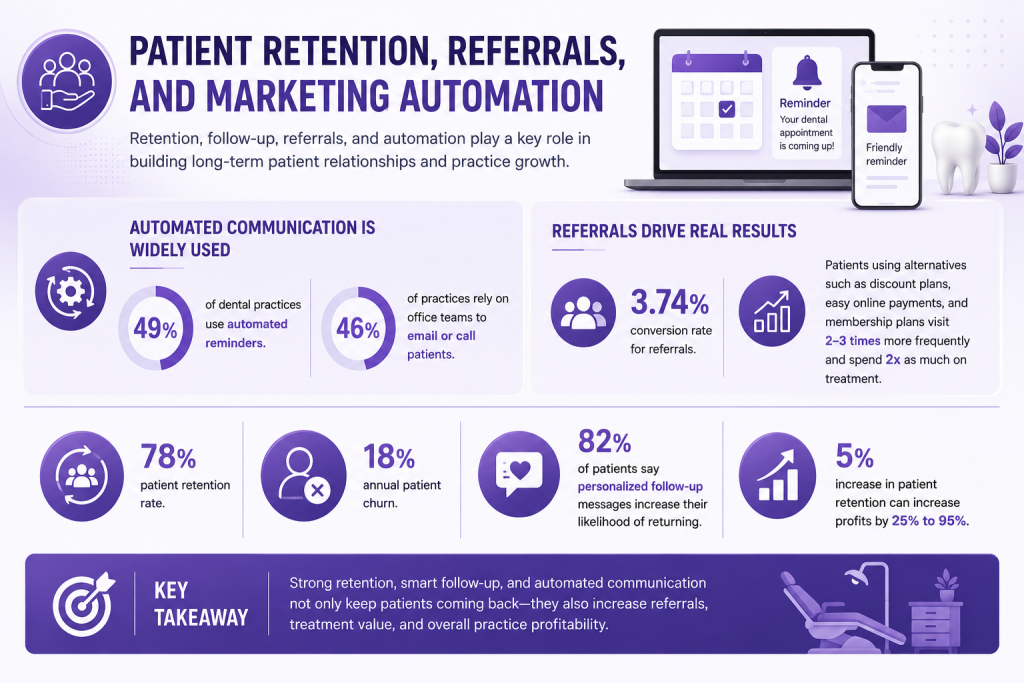
NexHealth reports that 49% of dental practices use automated reminders, while 46% rely on office teams to email or call patients. Automated communication can therefore represent an important part of the patient follow-up process.
NexHealth also cites Marketo research reporting a 3.74% conversion rate for referrals. The same source reports that patients using alternatives such as dental discount plans, easy online payments, and patient membership plans visit dentists 2–3 times more frequently and spend twice as much on treatment compared with other patients.
Additional dental marketing research reports a 78% patient retention rate and 18% annual patient churn, while 82% of patients say personalized follow-up messages increase their likelihood of returning.
Zevi Digital also reports that increasing patient retention by just 5% can increase profits by 25% to 95%.
Sources: (Web Tonic, NexHealth, ZipDo)
Conclusion
The data shows that digital marketing influences nearly every stage of the dental patient journey, from discovering a practice through search to reading reviews, visiting a website, booking an appointment, and staying connected afterward. Search visibility, paid advertising, mobile performance, online booking, and reputation management all contribute to how effectively practices attract new patients.
These dental marketing statistics also highlight the value of looking beyond patient acquisition. Automated reminders, personalized follow-up, referrals, and retention strategies can help practices strengthen patient relationships and create greater long-term value from their marketing efforts.
Sources:
https://zevidigital.com/15-dental-marketing-statistics-every-dentist-must-know
https://www.nexhealth.com/resources/dental-marketing-statistics
https://orthomarketing.com/dental-marketing-stats-in-2024/
https://www.webtonic.io/blog/dental-digital-marketing-statistics
https://archdentalmarketing.com/blog/dental-marketing-statistics/