
Automotive marketing has become increasingly dependent on digital channels as car buyers use search engines, dealership websites, social media, video, reviews, and online tools throughout the buying process. At the same time, many vehicle purchases still take place at dealerships, creating a customer journey that moves between digital and offline channels.
These automotive marketing statistics cover automotive advertising, search, buyer research, websites, lead generation, social media, video, paid advertising, CRM, and marketing attribution.
Automotive Digital Marketing and Advertising Statistics
Automotive advertising represents a significant share of marketing expenditure in the U.S., with digital channels accounting for a growing portion of industry budgets. Social advertising is also expanding as automotive brands and dealerships invest more heavily in digital platforms.
| Automotive advertising statistic | Figure |
| U.S. automotive local advertising spend in 2024 | More than $12 billion |
| U.S. automotive digital advertising share in 2024 | 74.7% |
| Dealer advertising budgets allocated to digital channels | 72.2% |
| Global automotive social advertising market in 2025 | $8.2 billion |
| Projected global automotive social advertising market in 2026 | $9.1 billion |
| Projected global automotive social advertising market in 2034 | $21.8 billion |
| Automotive social advertising CAGR through 2034 | 11.4% |
| Video’s share of automotive social ad spend | 38.5% |
According to Statista’s U.S. automotive advertising data, local automotive advertising expenditure exceeded $12 billion in 2024, while digital advertising accounted for 74.7% of automotive advertising spending.
Individual manufacturers also allocate substantial budgets to advertising. In 2023, Toyota Motor Sales USA spent approximately $661.3 million on U.S. advertising, compared with approximately $603 million for Chevrolet and $314.6 million in local advertising expenses for Ford.
The global automotive social advertising market reached $8.2 billion in 2025, according to the 2026 automotive social media research provided, and is projected to reach $21.8 billion by 2034.
Sources: (Statista, Demand Local, Web Tonic)
Automotive Search and Local SEO Statistics
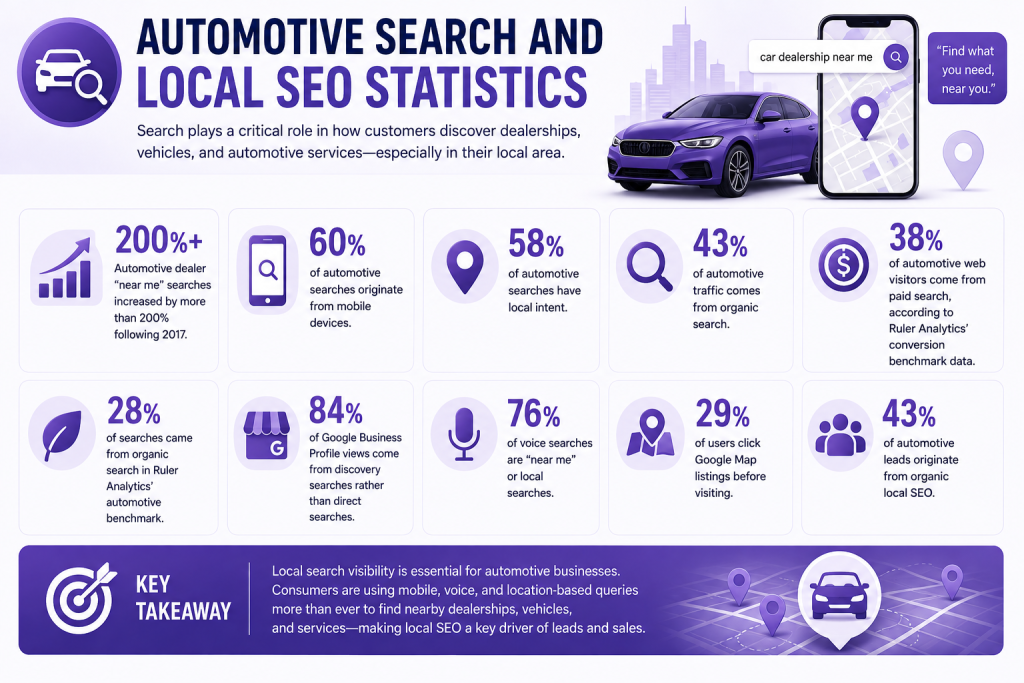
Search is an important part of automotive discovery, particularly for consumers looking for nearby dealerships, vehicles, and automotive services. Improving local search visibility for automotive businesses can help companies reach customers when these location-based searches take place.
Local and search-related automotive marketing statistics include:
- Automotive dealer “near me” searches increased by more than 200% following 2017.
- 60% of automotive searches originate from mobile devices.
- 58% of automotive searches have local intent.
- 43% of automotive traffic comes from organic search.
- 38% of automotive web visitors come from paid search, according to Ruler Analytics’ conversion benchmark data.
- 28% of searches came from organic search in Ruler Analytics’ automotive benchmark.
- 84% of Google Business Profile views come from discovery searches rather than direct searches.
- 76% of voice searches are “near me” or local searches.
- 29% of users click Google Map listings before visiting.
- 43% of automotive leads originate from organic local SEO.
These figures show how important local search visibility can be for automotive businesses competing for customers in specific geographic markets. The growing use of conversational and location-based queries is also reflected in broader voice search statistics, particularly as consumers increasingly use voice assistants to find nearby businesses and services.
Sources: (Demand Local, Marketing LTB, Ruler Analytics, BrightLocal)
Automotive Buyer Research and Online Shopping Statistics
Digital research is now a central part of the vehicle purchasing process. Consumers compare brands, websites, pricing, financing, vehicle histories, reviews, and inventory before deciding which vehicle or dealership to pursue.
| Automotive buyer statistic | Figure |
| Car buyers researching online before purchase | 92% |
| Vehicle buyers using digital channels for information | 95% |
| Average websites visited during research | 4.9 |
| Buyers comparing at least three brands | 64% |
| Buyers expecting transparent online pricing | 85% |
| Buyers comparing financing options online | 39% |
| Buyers checking vehicle history reports online | 62% |
| Buyers researching financing before choosing a car | 52% |
| Buyers wanting upfront monthly payment estimates | 83% |
| Buyers preferring online test-drive booking | 61% |
| Buyers preferring online inventory updates | 74% |
| Buyers wanting online financing pre-approval | 60% |
A separate automotive marketing analysis reports that shoppers visit an average of 4.2 websites during the purchasing process, compared with the 4.9-site figure reported by another study. These figures come from different research and are therefore presented separately rather than combined.
The amount of time consumers spend researching also varies between studies. Cox Automotive research cited in the supplied material reports an average of 6 hours and 41 minutes of online research, while a separate 2026 automotive social media analysis reports 14 hours before contacting a dealer.
Despite the extensive digital research involved, Hyundai research cited by Ruler Analytics found that 95% of purchases happen at the dealership. This illustrates the importance of connecting digital marketing activity with offline customer interactions.
Sources: (Demand Local, Ruler Analytics, Marketing LTB, Cox Automotive)
Automotive Website, Mobile and Lead Generation Statistics
Automotive websites can attract significant traffic, but converting that traffic depends on website performance, mobile usability, lead capture, and follow-up.
| Website and lead statistic | Figure |
| Average automotive website sessions | 11.2K |
| Industry-standard automotive website conversion rate | 1.5% |
| Average automotive conversion rate in Ruler Analytics benchmark | 2% |
| Conversion rate achieved by top performers in that benchmark | Up to 16% |
| Average cost per purchased automotive lead | $250 |
| Leads never entering CRM systems | 13.3% |
| Leads arriving outside business hours | 40% |
| Users abandoning forms longer than five fields | 42% |
| Users abandoning slow dealership websites | 44% |
| Mobile users leaving non-optimized websites | 60% |
Mobile devices play a particularly large role in automotive research. One automotive digital marketing analysis reports that 61% of automotive eCommerce website traffic is mobile, while more than 70% of car buyers use smartphones or tablets during their buying journey.
Another 2026 automotive marketing analysis found that 73% of buyers use smartphones during dealership visits, and 51% use multiple devices during research.
Lead response is another area where automotive marketers can lose opportunities. One analysis found that 67% of leads miss the 24-hour follow-up window, while a separate dataset reports that 52% of leads never receive follow-up within 24 hours.
Sources: (Demand Local, Ruler Analytics, Marketing LTB)
Automotive Social Media and Video Marketing Statistics
Social media and video are increasingly important for automotive research, particularly because vehicles are highly visual products that consumers often want to see demonstrated before visiting a dealership.
Automotive video and social media statistics include:
- 78% of automotive shoppers watch video reviews before purchasing.
- 87% of people say watching a video has convinced them to buy a product or service.
- 40% of shoppers discover new vehicles through video marketing.
- 68% of buyers prefer video ads over static ads.
- 67% of buyers expect virtual car tours.
- 57% of buyers engage with video ads under 30 seconds.
- 72% of automotive marketers use video advertising.
- 68% of users prefer video testimonials over written reviews.
- TikTok automotive follower counts increased 200% year over year in 2025.
- 37% of U.S. adults use TikTok.
- 62% of TikTok users rely on the platform for product reviews or recommendations.
- Social channels influence 26% of vehicle purchases.
Test-drive content has also experienced significant growth. Watch time for “test drive” videos increased by more than 65% over two years, according to the automotive research provided.
Automotive social media engagement rates
| Platform | Automotive engagement rate |
| TikTok | 4.2% |
| YouTube | 1.8% |
| 1.45% | |
| 1.1% | |
| 0.35% |
The differences between platforms show that automotive brands can experience substantially different engagement levels depending on where they publish content.
Sources: (Marketing LTB, Demand Local, Web Tonic, Ruler Analytics)
Automotive PPC and Paid Advertising Statistics
Paid advertising can produce strong results in automotive marketing, although performance varies according to the type of campaign, audience, and conversion being measured.
Research into automotive digital advertising reports a 14.67% Google Ads conversion rate for automotive repair and service, with an average cost of $28.50 per lead. For automotive repair, service, and parts more broadly, the reported PPC conversion rate is 12.61%. Vehicle sales campaigns show an 8.29% click-through rate and a 7.76% conversion rate.
A separate automotive conversion benchmark provides the following channel-level results:
| Marketing channel | Conversion rate |
| Organic social | 2.9% |
| Organic search | 2.5% |
| Direct | 2.0% |
| Referral | 1.8% |
| Paid social | 1.7% |
| Paid search | 1.3% |
| 0.8% |
These figures come from a conversion benchmark analysis covering automotive marketing channels and should be viewed as a separate dataset from the individual PPC campaign performance figures above.
Marketing automation also shows strong reported results. Automotive dealerships using marketing automation platforms achieve an average 8X ROI, while companies using data-driven marketing achieve 20–40% better ROI.
Sources: (Demand Local, Ruler Analytics)
Automotive CRM, Lead Nurturing and Attribution Statistics
CRM and marketing technology can help dealerships manage leads and customer interactions, but adoption remains inconsistent.
CRM and Marketing Technology
- 84% of dealerships own digital retail tools, but only 30% actively use them.
- Digital retail tools increase units sold per salesperson from 10.8 to 16.
- 39% of dealerships invest in CRM automation.
- 52% of dealerships underutilize their CRM data.
These figures suggest that having the technology is not necessarily enough. How effectively dealerships use their CRM and marketing systems can have a major impact on how they manage opportunities generated through digital marketing and lead generation for automotive businesses.
This broader focus on attracting, engaging, and nurturing prospects is consistent with trends seen across inbound marketing statistics, where the customer journey extends beyond the initial point of discovery.
Lead Nurturing and Response Times
Lead follow-up remains another significant challenge:
- 70% of leads are not properly nurtured.
- 47% of automotive leads require at least five follow-ups.
- 58% require nurturing beyond 10 days.
- 69% of buyers expect instant email responses.
- 68% expect instant responses through chat or SMS.
The numbers show why the process after an inquiry matters. Generating a potential customer is only the beginning; timely responses and consistent follow-up can determine whether that opportunity progresses further.
Attribution and Phone Leads
Attribution can be particularly difficult in automotive marketing because customers often move between digital and offline channels. Only 25% of dealerships accurately track lead attribution, while 35% lack proper attribution tracking.
Phone calls add another layer to the customer journey. Ruler Analytics found that 48% of website visitors call car dealerships, while automotive digital marketing research reports that phone leads convert 30% faster than web leads and have 28% higher retention.
This makes it important for dealerships to consider calls, inquiries, follow-ups, and eventual sales when evaluating the performance of their marketing efforts.
Sources: (Demand Local, Marketing LTB, Ruler Analytics)
Automotive Social Advertising and User-Generated Content Statistics
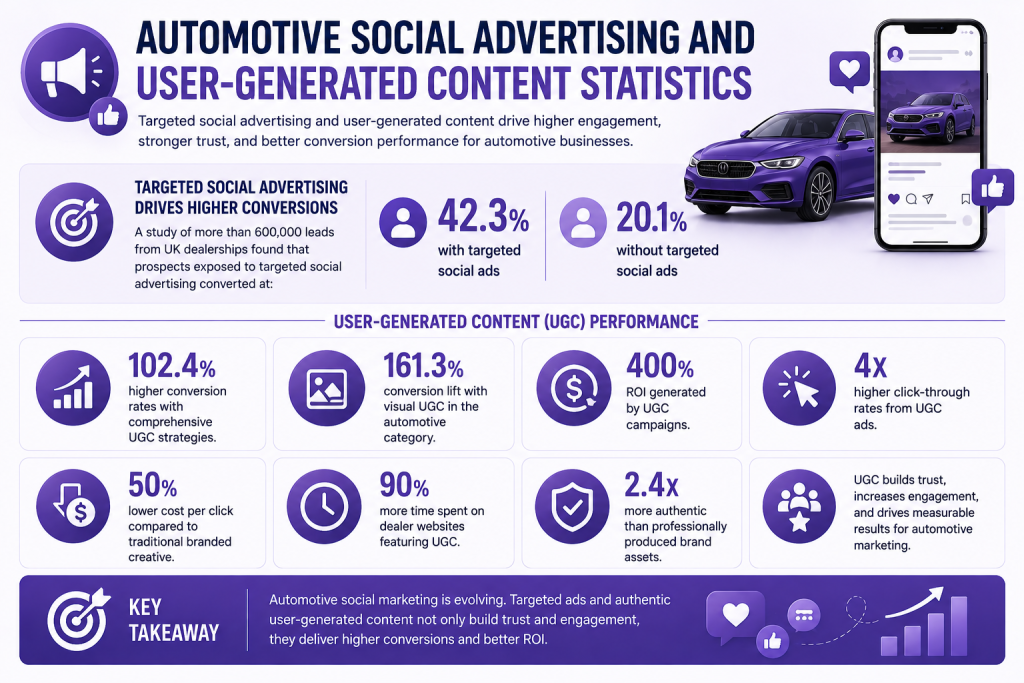
Targeted social advertising and user-generated content can influence automotive conversion performance, particularly when campaigns are designed around shoppers who have already shown interest. A study of more than 600,000 leads from UK dealerships found that prospects exposed to targeted social advertising converted at 42.3%, compared with 20.1% for prospects who were not served targeted ads.
User-generated content also shows strong reported performance in automotive marketing:
- Comprehensive UGC strategies produce 102.4% higher conversion rates.
- Visual UGC produces a 161.3% conversion lift in the automotive category.
- UGC campaigns deliver 400% ROI.
- UGC ads generate 4X higher click-through rates.
- Cost per click is approximately 50% lower than traditional branded creative.
- Visitors spend 90% more time on dealer websites featuring user-generated content.
- Consumers rate UGC 2.4 times more authentic than professionally produced brand assets.
These figures indicate that automotive social marketing is increasingly moving beyond basic brand awareness toward targeted advertising, customer-generated content, and measurable conversion activity.
Sources: (Web Tonic)
Conclusion
The automotive marketing statistics show how significantly the vehicle buying journey has shifted toward digital research. Most buyers now use online channels to compare vehicles, dealerships, pricing, reviews, and financing before making contact, while many purchases still take place at the dealership.
For automotive marketers, this makes search visibility, mobile experiences, video, social media, and effective lead follow-up increasingly important. The data also highlights the need to connect digital marketing activity with phone calls, dealership visits, and completed sales to understand which channels are actually driving results.
Sources:
- https://www.demandlocal.com/blog/automotive-digital-marketing-statistics/
- https://www.brightlocal.com/research/google-my-business-insights-study/
- https://marketingltb.com/blog/statistics/automotive-marketing-statistics/
- https://www.statista.com/topics/1601/automotive-advertising
- https://www.webtonic.io/blog/automotive-social-media-marketing-statistics
- https://www.ruleranalytics.com/blog/reporting/automotive-marketing-statistics/
- https://www.coxautoinc.com/insights/cox-automotive-car-buyer-journey-study-finds-efficiency-digital-tools-and-ai-drive-record-satisfaction/