Renters insurance statistics offer a detailed look at how tenants across the United States protect their belongings, manage financial risk, and respond to rising housing uncertainty. As rental demand continues to grow, these insights highlight shifts in affordability, adoption rates, and regional price variation.
Understanding renters insurance statistics helps explain how renters balance cost and protection in an increasingly expensive housing landscape. At QuoteFlow Marketing, we analyze the latest data to show how geographic risk, income pressure, and awareness gaps influence insurance decisions.
Nationwide Trends in Renters Insurance
Renters insurance statistics show that adoption has steadily increased over the past decade. More than half of U.S. renters now carry coverage, reflecting a broader shift toward financial protection against property loss and liability risks.
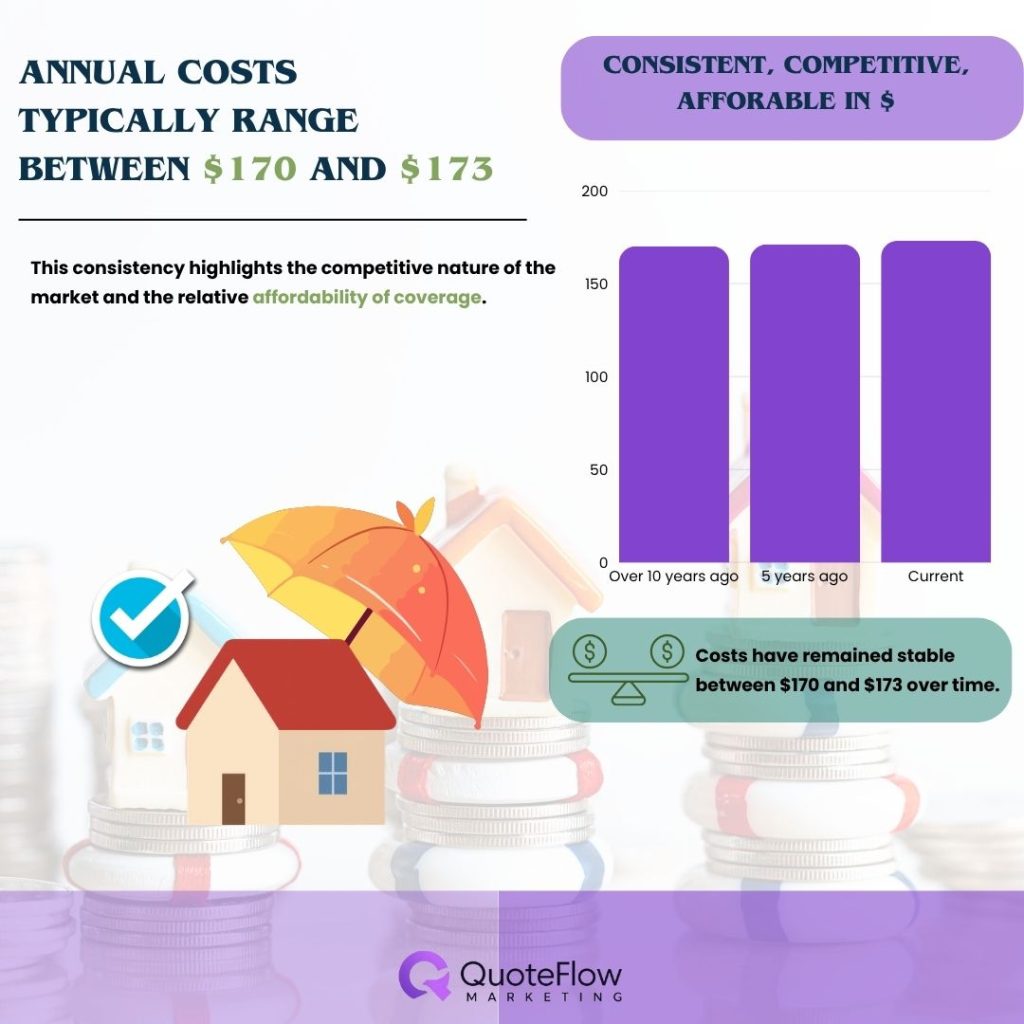
Recent renters insurance statistics indicate that average premiums remain stable despite inflation. Annual costs typically range between $170 and $173, based on long-term industry data. This consistency highlights the competitive nature of the market and the relative affordability of coverage.
Adoption has also risen significantly, climbing from around 31% in 2012 to approximately 55%–57% in recent years. This growth reflects stronger awareness, as well as increased requirements from landlords.
Average Cost Trends Over Time
Pricing trends in the latest renters insurance statistics show that renters insurance has remained stable and even slightly declined over time. Between 2013 and 2022, average premiums dropped from roughly $188–$190 to about $170–$171, with minimal annual fluctuations.
Most yearly changes stayed below 3%, indicating a predictable and stable pricing environment. Compared to homeowners insurance, which averages $2,424 annually, renters insurance stands out as a low-cost protection option with strong value.
Renters Insurance by State
State-level data reveals significant variation in pricing. Annual premiums can range from as low as $89 for basic coverage in Wyoming to over $300 in higher-risk states like Rhode Island.
Most Expensive States For Renters Insurance
The latest renters insurance statistics show that higher premiums are typically concentrated in regions with elevated environmental risk and frequent claims.
| State | Average Cost ($) |
| Mississippi | 262 |
| Louisiana | 243 |
| Alabama | 219 |
| Oklahoma | 216 |
| Arkansas | 205 |
| Georgia | 205 |
| Texas | 199 |
These figures show a clear connection between severe weather exposure and increased insurance costs.
Least Expensive States For Renters Insurance
Lower premiums are generally found in states with stable weather patterns and fewer claims.
| State | Average Cost ($) |
| North Dakota | 123 |
| South Dakota | 129 |
| Minnesota | 135 |
| Wisconsin | 141 |
| Wyoming | 142 |
Geographic Risk Patterns
Geographic location plays a major role in pricing differences. Southern and coastal regions tend to have higher premiums due to hurricanes, flooding, and severe storms. In contrast, Midwestern and northern states benefit from more stable conditions.
Urban density also impacts pricing. Higher population areas often see increased premiums due to elevated theft risk and more frequent claims.
Coverage and Policy Structure
Most renters insurance policies follow a standard structure that includes:
- Personal property protection
- Liability coverage
- Additional living expenses
Typical coverage levels include around $20,000 for personal property and at least $100,000 in liability protection.
Costs vary depending on coverage limits. Basic policies under $15,000 may cost about $130 annually, while higher coverage exceeding $100,000 can surpass $400 per year. This range in the renters insurance statistics shows how customization directly affects pricing.
Consumer Awareness Gaps
Data reveals a significant gap between available coverage and consumer understanding.
- Over 90% of tenants end up paying for their own property damage
- Around 84% are unaware that liability coverage protects against injuries in their home
- Many renters underestimate the full value of their policy
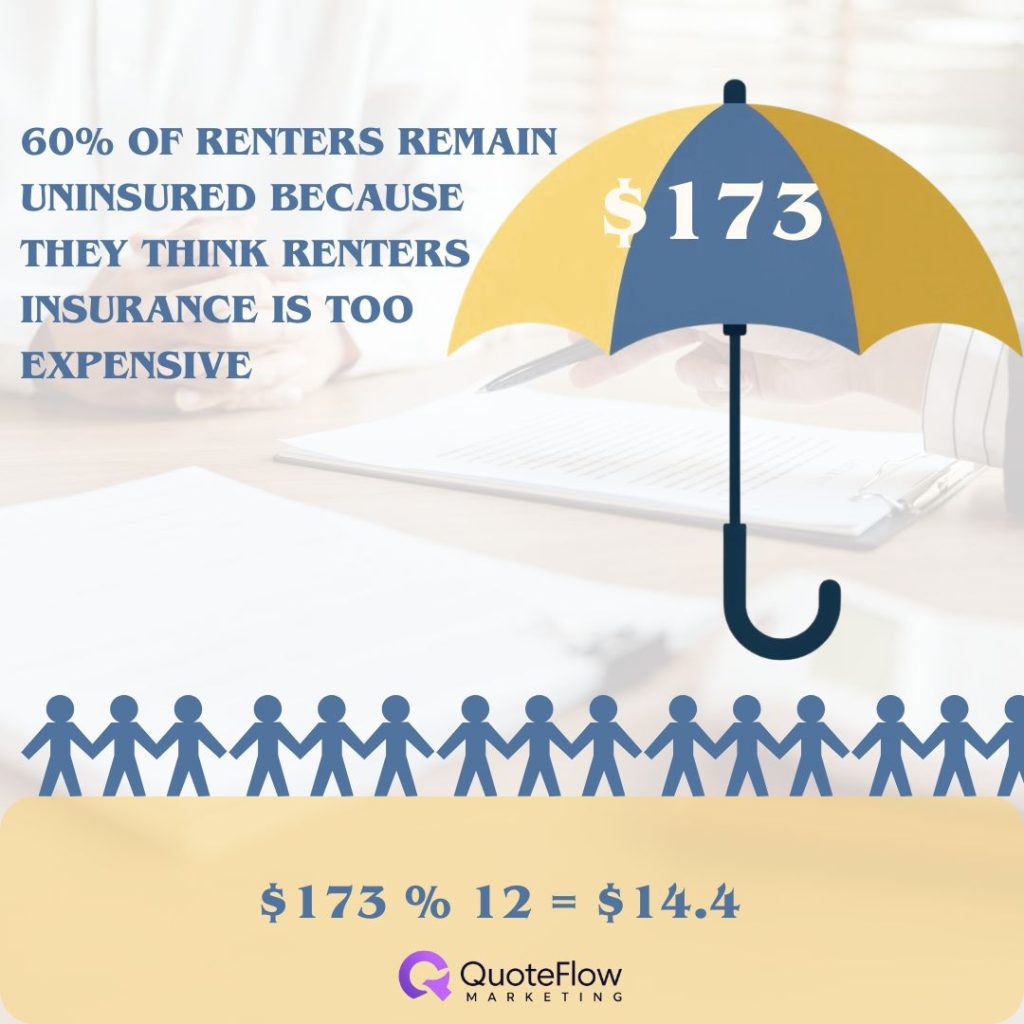
- Only 41% have rental insurance while the remaining lack coverage because they think it’s too expensive
This suggests that lack of awareness—not affordability—is one of the main barriers to adoption.
Housing Costs and Financial Pressure
Housing affordability continues to influence insurance decisions. Approximately 48.2% of renters spend more than 30% of their income on housing and utilities, placing them in a cost-burdened category.
Even though renters insurance often costs less than $15 per month, it is still overlooked by many households. However, a single uninsured loss can far exceed the annual premium, reinforcing the importance of coverage.
Conclusion
The data points to a consistent conclusion: renters insurance remains one of the most affordable yet underutilized forms of financial protection. For insurance providers, these insights also highlight a growing demand for qualified insurance leads, creating new opportunities to connect with renters actively seeking coverage.
With stable pricing, flexible coverage options, and millions of uninsured renters, there is strong potential for continued growth. As housing trends evolve, renters insurance statistics will remain essential for understanding how cost, risk, and consumer behavior shape the rental market.
Sources:
- https://www.bankrate.com/insurance/homeowners-insurance/renters-insurance-cost
- https://nicrisinsurance.com/a-look-at-renters-insurance-statistics-in-the-united-states
- https://www.forbes.com/advisor/homeowners-insurance/how-much-is-renters-insurance
- https://www.sofi.com/learn/content/how-much-is-renters-insurance
- https://www.moneygeek.com/insurance/renters/average-cost-of-renters-insurance/ https://www.property118.com/majority-of-landlords-cover-property-damage-caused-by-tenants
- https://www.geico.com/information/aboutinsurance/renters/does-renters-insurance-cover-injuries
- https://www.jchs.harvard.edu/press-releases/new-report-finds-cooling-rental-markets-affordability-crisis-deepens-renters
- https://pmc.ncbi.nlm.nih.gov/articles/PMC12333583
- https://www.iii.org/fact-statistic/facts-statistics-renters-insurance